- Center on Health Equity & Access
- Clinical
- Health Care Cost
- Health Care Delivery
- Insurance
- Policy
- Technology
- Value-Based Care
Telehealth, Urgent Care Showed Largest Growth From 2018 to 2019, Among Care Venues Studied
FH Healthcare Indicators reveal trends and patterns in the places where patients receive health care.
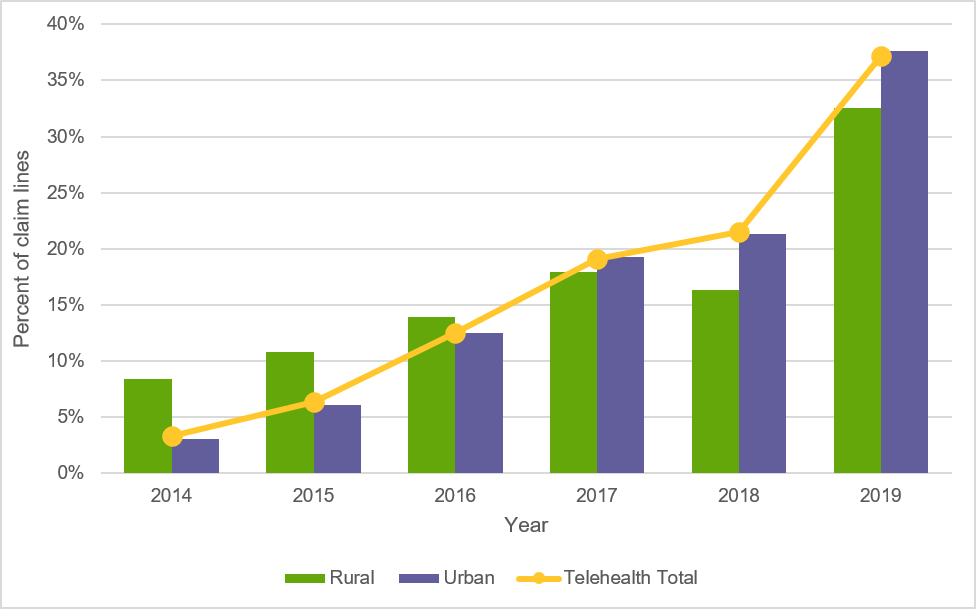
From 2018 to 2019, telehealth increased in utilization by 73% (Figure 1), urgent care centers by 47%, retail clinics by 39%, emergency departments (EDs) by 33% and ambulatory surgery centers (ASCs) by 30%. These are among the findings in a new FAIR Health white paper containing the fourth annual edition of FH® Healthcare Indicators and FH® Medical Price Index.
FIGURE 1. Percent of Claim Lines With Telehealth Usage by Rural, Urban and National Settings, 2014-2019

(Source: FAIR Health)
As with previous editions, this year’s edition of FH Healthcare Indicators and FH Medical Price Index is intended to provide clarity to all health care stakeholders in a rapidly changing health care environment. FAIR Health, a national, independent nonprofit organization dedicated to bringing transparency to health care costs and health insurance information, bases the reports on its database of over 32 billion privately billed health care claim records—the largest such repository in the country.
FH Healthcare Indicators reveal trends and patterns in the places where patients receive health care. Focusing on alternative places of service—retail clinics, urgent care centers, telehealth and ASCs—as well as EDs, FH Healthcare Indicators evaluate changes in utilization, geographic and demographic factors, diagnoses, procedures and costs. For example, FH Healthcare Indicators show that in 2019, the median charge amount for a 30-minute new patient office visit ranged from $150 in a retail clinic to $217 in an office to $239 in an urgent care center.
FH Medical Price Index
FH Medical Price Index reports shifts in costs and facilitates useful comparisons among medical prices in 6 procedure categories from May 2012 to November 2020:
- Professional evaluation and management (E&M; excluding E&Ms performed in a hospital setting);
- Hospital E&M (excluding E&Ms performed in a professional setting, such as typical office visits);
- Medicine (excluding E&Ms);
- Surgery (procedures for which the physician would bill);
- Pathology and laboratory (technical and professional components, i.e., both equipment and professional services); and
- Radiology (technical and professional components).
The reports reflect professional fees and related costs; they do not reflect facility fees.
For the period November 2019 to November 2020:
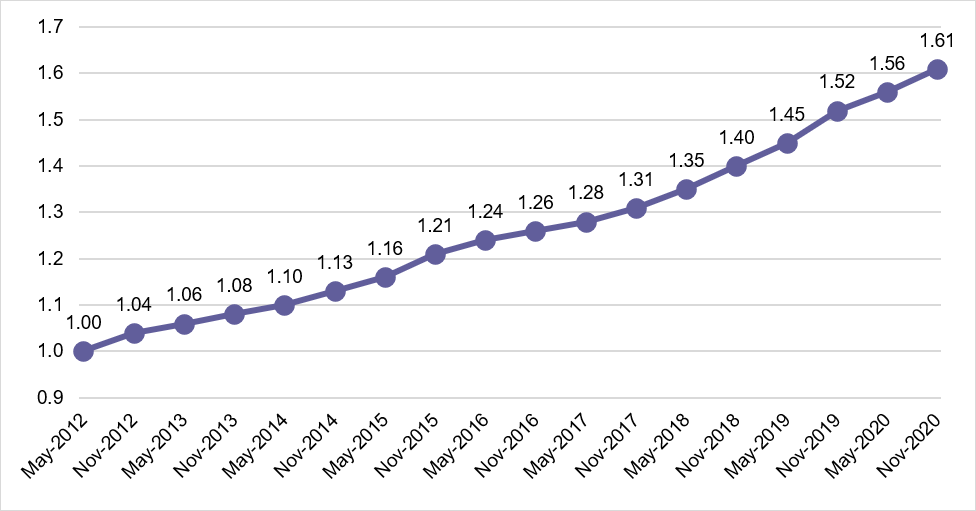
Of the 6 procedure categories, hospital E&Ms had the greatest percent increase in charge amount index, 6% (Figure 2), and in allowed amount index, 10%.
The radiology charge amount index decreased one percent, the only decrease in either charge amount or allowed amount indices.
Radiology had the lowest percent increase in allowed amount index, 3%.
FIGURE 2. Hospital E&M Charge Amount Index

(Source: FAIR Health)
In this edition, as in previous editions, FH Healthcare Indicators and FH Medical Price Index each advance one year in the data they report: FH Healthcare Indicators to 2019 and FH Medical Price Index to 2020. For this reason, FH Healthcare Indicators do not include data from the COVID-19 pandemic year (next year’s edition will extend to 2020), whereas FH Medical Price Index does. Indeed, this year’s FH Healthcare Indicators present a valuable picture of the nation’s healthcare environment just before COVID-19 arrived in the United States, while FH Medical Price Index offers an account of healthcare pricing trends in the midst of the pandemic.
As in previous years, FH Healthcare Indicators and FH Medical Price Index are highly relevant to understanding the nation’s healthcare system. We hope that this new edition continues to inform decision making throughout the healthcare sector by payors, providers, government officials, policy makers, academic researchers and others.
For the new white paper FH® Healthcare Indicators and FH® Medical Price Index 2021: An Annual View of Place of Service Trends and Medical Pricing, click here.
Author Information
Robin Gelburd, JD, is the president of FAIR Health, a national, independent nonprofit organization with the mission of bringing transparency to healthcare costs and health insurance information. FAIR Health possesses the nation’s largest collection of private healthcare claims data, which includes over 32 billion claim records and is growing at a rate of over 2 billion claim records a year. Certified by the Centers for Medicare & Medicaid Services (CMS) as a national Qualified Entity, FAIR Health also receives data representing the experience of all individuals enrolled in traditional Medicare Parts A, B and D; FAIR Health includes among the private claims data in its database, data on Medicare Advantage enrollees. Ms. Gelburd is a nationally recognized expert on healthcare policy, data and transparency.
Specialty and Operator Status Influence Electronic Health Record Use Variation
January 22nd 2026Operators demonstrated specialty-specific differences in electronic health record efficiency, timeliness, and after-hours use, highlighting how workflow and training shape documentation behaviors across medical disciplines.
Read More
