- Center on Health Equity & Access
- Clinical
- Health Care Cost
- Health Care Delivery
- Insurance
- Policy
- Technology
- Value-Based Care
Defining Appropriate Quality Performance Metrics for Pharmacies Dispensing Oral Oncology Therapies
ABSTRACT
Pharmacy benefit managers use measures like the medication possession ratio (MPR) as a performance/quality metric to evaluate specialty pharmacies and assess direct and indirect remuneration clawback fees. Abundant evidence shows that measuring MPR does not correlate with patients’ experiences while on oral cancer oncolytics and does not accurately reflect their clinical outcomes. The authors demonstrate that as an alternative to MPR, the Florida Cancer Specialists & Research Institute’s Rx To Go in-house pharmacy offers value; it uses a multifaceted approach to comprehensively evaluate the services that specialty oncology pharmacies provide to patients with cancer who are being treated with oral oncolytics.
INTRODUCTION
Oral oncolytics play a major role in the treatment of patients with many types of solid tumors and hematologic malignancies. To fully benefit from these expensive therapies, patients need a high level of clinical and access support. Medically integrated oncology pharmacies like Rx To Go—the in-house, specialty oral oncology pharmacy for Florida Cancer Specialists & Research Institute—are specifically designed to help patients navigate their difficult cancer journey.
Despite abundant evidence that measures like medication possession ratio (MPR) do not correlate with patients’ experiences while on oral cancer oncolytics and do not accurately reflect their clinical outcomes, pharmacy benefit managers (PBMs) use MPR as a performance/quality metric to evaluate specialty pharmacies and assess direct and indirect remuneration (DIR) clawback fees. DIR fees were designed to be applied as a pharmacy performance metric for chronic diseases (eg, hypertension, diabetes, high cholesterol) measured under the CMS Star Rating System for Plan D sponsors. PBMs have misapplied these performance metrics to oncology pharmacies, which do not manage any patients with these chronic conditions.1
We at Rx To Go have identified the following predictive markers of successful management of patients on oral oncolytics. They are:
- enrollment into a patient management program under pharmacist supervision;
- time to first fill;
- MPR and proportion of days covered (PDC) as measurements of continuous fills;
- persistence on therapy;
- patient satisfaction score;
- prescriber satisfaction score; and
- drug waste management program.
We advocate using a multifaceted approach to evaluate pharmacy services. We demonstrate the value of this type of approach, with data from our implementation of quality performance metric scorecards, drug performance scorecards, and patient and provider satisfaction surveys. We also describe how a workflow strategy, the Rx To Go drug waste management program, efficiently reduces patient and payer costs while averting potential treatment issues that might impact patient health outcomes.
We call on PBMs, plan sponsors, and the Pharmacy Quality Alliance to work with the broader oncology specialty pharmacy community to develop specific performance metrics for oral oncolytics. All the stakeholders should collaborate to develop a set of metrics applicable to in-house and other specialty pharmacies that dispense oral oncolytics.
Background
Historically, CMS developed DIR fees to create a mechanism “…to preserve the competitive nature of the Part D program by ensuring a level playing field for Part D sponsors regardless of their contractual arrangements with” PBMs.2 CMS had envisioned DIR fees as a way to increase transparency on total drug cost.
However, as the PBMs began their mass mergers in recent years, they have twisted the DIR concept away from CMS’ original intent to increase their own profits. For example, they have reduced the transparency of DIR fee calculations and the accuracy of drug reimbursement rates.1 As a result, the Medicare Part D program and its beneficiaries (mostly patients 65 years and older) are experiencing increased prescription-related expenses,3 and pharmacy providers are losing money when PBM reimbursement of prescriptions is significantly lower than what they paid for the drug.4,5
DIR fees not only increase out-of-pocket drug cost for Medicare beneficiaries, but they also speed the beneficiaries’ entry into the Medicare coverage gap, especially when they are prescribed high-cost specialty medications like oral oncolytics.5,6 This further increases total Medicare spending. To avoid reporting these DIR fees to CMS, PBMs mask them by calling them network variable rates, network rebates, and pharmacy performance payments. These are clawback fees imposed by PBMs on pharmacy providers well after price negotiation, point of sale, and medication dispensation. This also means that patients have co-pays on the full transaction price to the pharmacy without seeing the co-pay reduction benefit from the DIR clawbacks. Thus, patients on Medicare enter the coverage gap much quicker and they face subsequent catastrophic 5% co-pays for the rest of the calendar year based on full pharmacy transaction cost at the time of claim adjudication.1
PBMs impose these performance-based DIR fees on pharmacy providers under numerous quality metrics categories, with higher scores rewarded by lower DIR fees. The logic of these performance metrics remains unclear since PBMs assess them in relation to certain maintenance medications for some chronic conditions (eg, high cholesterol, hypertension, diabetes, depression) but include DIR fee calculations against the gross reimbursement for all prescriptions received by pharmacy providers, not just the assessed maintenance medications. These fee schemes have further fueled increasing drug costs and boosted PBM profits.
PBMs have found the high cost of oral oncolytics to be an attractive target for their DIR fee tactics. This is despite the lack of any evidence-based rationale for applying irrelevant metrics—those developed for medications that, for instance, control diabetes or high cholesterol—to evaluate dispensation of oral oncolytics used by patients with cancer who face unique risks of disease progression, morbidity, and mortality, as well as treatment and disease-related adverse effects (AEs).
Another problem is that the quality metrics PBMs use to assess pharmacy providers differ depending on the PBM, making it even more difficult to attain high scores. In addition, the imposed performance DIR fees are typically assessed months after the drugs are dispensed and claims are submitted by pharmacy providers. The ensuing clawbacks of millions of dollars from pharmacy providers under the umbrella of DIR fees has become the norm for PBMs.
Furthermore, the CMS Star Rating criteria that PBMs utilize to evaluate pharmacy provider performance include adherence measures, such as MPR and PDC, but don’t include the key performance criteria (eg, immediate time to fill, dose adjustments, patient education, patient adherence to therapy) that oncology practices use to assess their own performance. In its 2018 position statement on PBMs and their impact on cancer care, the American Society of Clinical Oncology (ASCO) said:
“…CMS should instruct contractors and PBMs to discontinue application of current Star performance ratings and related DIR clawbacks on oncology dispensing physicians and practice-based pharmacies, instead of relying on measures and standards that are more appropriate to the specialty. Star performance ratings were not intended for this purpose and, as currently structured, are not appropriate for oncology practice. Both flat and percentage-based fees unfairly disadvantage cancer care providers without demonstrably improving quality or patient outcomes.”6
We argue that measuring MPR does not correlate well with patients’ experiences while on oral cancer oncolytics and does not accurately reflect their clinical outcomes. Instead, we at Rx To Go advocate using a multifaceted approach to evaluate pharmacy services. To demonstrate the value of this type of approach, we share data from our implementation of Quality Performance Metric (QPM) scorecards, drug performance scorecards, and patient and provider satisfaction surveys. We also describe how a workflow strategy, the Rx To Go drug waste management program, efficiently reduces patient and payer costs while averting potential treatment issues that might impact patient health outcomes.
What Unique Challenges Are Posed by Oral Oncolytics?
Considerable advances in the early detection, diagnosis, and treatment of many types of solid tumors and hematologic malignancies have converted some cancers into chronic diseases, allowing patients to live longer with proper management.7 Oral oncolytics play a major role in the treatment of patients with many types of cancers such as breast cancer, prostate cancer, non–small cell lung cancer (NSCLC), chronic myelogenous leukemia (CML), and chronic lymphocytic leukemia (CLL).8,9 As adjuvant therapy or to control advanced disease, some patients must continue taking oral anticancer medications for years, potentially for their entire lives. Self-administered oral targeted agents have nearly supplanted the use of clinic-administered intravenous chemoimmunotherapy as early-line therapies for many patients with CLL and CML.10,11
Compared with intravenously administered medications, advantages of oral oncolytics include convenience and flexibility in timing and administration, less use of health care resources, and potentially better quality of life.
Disadvantages include decreased opportunities to interact with health care providers, burden on patients (and/or their caregivers) to maintain adherence, monitoring for and managing AEs, and the need to promptly communicate with providers when concerns arise. Patients on oral oncolytics require extensive education and periodic reinforcement to make sure they adhere to the prescribed dosing regimen, know how to monitor and respond to symptoms of emerging toxicities (ie, how to manage them and when to contact the provider), and understand which other drugs, foods, beverages, and alternative therapies have the potential to cause drug-drug interactions.
For assorted reasons, many patients do not fill the prescription they receive (noninitiation), do not take the drug as prescribed (nonadherence), or do not continue long-term use of the medication (early discontinuation).8 Suboptimal use of prescribed oral medications can negatively impact patient outcomes and result in higher health care utilization and costs.8,12,13 Examples of negative impacts on outcomes in patients with cancer include:
- lower efficacy;
- disease flare-ups;
- early cancer progression;
- more toxicity, if taking higher doses than prescribed; and
- decrease in quality of life, if disease is not controlled.
Barriers to adherence to oral oncolytics include low health literacy and limited knowledge on the part of patient and/or caregiver; variability and limitations of insurance coverage; the complexity of administration instructions; AEs (including rare but potentially life-threatening ones); and high out-of-pocket expenses.14-16 For example, a retrospective analysis of adults who had oral oncolytics newly prescribed to them at a tertiary cancer center reported that lack of insurance (and type of insurance), pharmacy transfers, and cost assistance program, were significantly associated with longer time to receipt of the prescribed medication.16 This study reported mean time-to-receipt of approximately 16 days for patients with no insurance and 9 days for patients with Medicare compared with 4 days for patients with commercial insurance.
Successful outpatient management of patients requiring long-term treatment with oral oncolytics requires patient-centered, multidisciplinary coordination and collaboration that integrate pharmacist involvement in patient education, AE monitoring, and management to improve treatment adherence.10,11
Oral oncolytics are costly, and the majority of public and private health care/medical insurance payers rely on PBM centralized mail order pharmacies (eg, Express Scripts, OptumRX, CVS Caremark) to process and fulfill prescription claims.17 However, delivery of oral medications to patients via a centralized, mail order pharmacy is inadequate because of potential delays caused by communication challenges (for patients and providers), processing and transit times; fragmentation of care provision; inadequate patient follow-up and monitoring; and inadequate research on financial assistance options for patients.18-20 These limitations are particularly harmful to the unique challenges faced by patients with cancer who require treatment initiation as well as long-term therapy with oral oncolytics. In-house, medically integrated dispensing (MID) pharmacies offer a viable, streamlined alternative to serving this population.
What Are In-House or MID Pharmacies?
An MID or in-house pharmacy model is defined as a dispensing pharmacy within an oncology center of practice that promotes a patient-centered and multidisciplinary team approach, which results in highly coordinated quality care and better patient outcomes.21,22 Providing continuous, patient-centered, multidisciplinary, coordinated quality care is a key goal of all cancer care because it essential for optimizing patient outcomes.
The advantages of using in-house or MID pharmacies over centralized mail order pharmacies to dispense oral oncolytics include20,23:
- immediate, unlimited access to electronic health records (EHRs), protected under the Health Insurance Portability and Accountability Act of 1996, allowing timely information gathering and communication with the prescriber’s team;
- cost savings, because of the ability to quickly respond to prescription holds and changes in dosing (thus limiting drug waste);
- immediate verification of insurance coverage;
- support and help to research financial assistance;
- opportunities to ensure that patients complete and receive prescription refills on time;
- integration of prescription information with other patient information (eg, test results, use of other drugs);
- availability of a pharmacist to individualize patient education, monitoring, and follow-up to improve safety, adherence, and persistence;
- streamlined and more accessible communication; and
- increased patient and prescriber satisfaction.
Research has demonstrated the benefits of the in-house dispensing model over traditional mail order pharmacies. For example:
- A 2019 retrospective study found that in-office dispensing of oral oncolytics reduces monetary waste—as assessed in terms of returned medications, therapy discontinuation, and dose adjustments—compared with mail order pharmacy dispensing.24
- A 2021 retrospective study reported that patients who filled their prescription for oral oncolytics at an internal health-system specialty pharmacy had better PDC, MPR, and time to treatment compared with patients who filled their prescriptions at external specialty pharmacies.25
How Is Adherence Used as a Quality Metric for Specialty Pharmacies?
Defining adherence
The World Health Organization has defined adherence to long-term therapy as the extent to which a person’s behavior (eg, taking medication, following a diet, enacting lifestyle changes) corresponds with agreed-upon recommendations made by a health care provider.26 Specifically pertaining to the taking of medications, adherence is generally considered to be the process by which patients take their medications as prescribed in terms of timing, dosing, and frequency.12,27 Patient adherence includes 3 major phases: initiation (or failure to begin treatment), implementation (or incomplete dosing), and persistence, or continuation of treatment.28 Adherence rates reported in studies of oral anticancer therapies commonly range from 46% to 100%, but they can dip as low as 33% for various reasons, including the types of cancer, study population, and adherence measure used.
Adherence is a dynamic process and the threshold for what is sufficient adherence to optimize clinical benefit and minimize AEs is not easily defined.27,29,30 In patients with chronic conditions, deviations from optimal adherence may be frequent and can include isolated/sequential omissions, drug holidays, and compensatory overdosing.27,30 Factors that impact adherence include9,27,29,31:
- disease characteristics (eg, type, severity, duration);
- patient characteristics (eg, clinical characteristics, social and familial environment);
- treatment characteristics (eg, type of drug, drug pharmacology, toxicities); and
- provider/health care system (eg, lack/type of insurance, relationship with provider, duration of visits).
In patients with cancer specifically, many factors at the individual, cultural, and system levels affect adherence to oral oncolytics.
Measuring adherence
Adherence can be assessed using direct measures (eg, directly observed therapy, testing urine and/or blood for biomarkers) and indirect measures (eg, self-reporting/patient diaries, electronic pill bottles, pill counts, pharmacy data, administrative claims data, clinical response).8 This report focuses on the use of administrative claims data to monitor drug adherence.
Table 1.
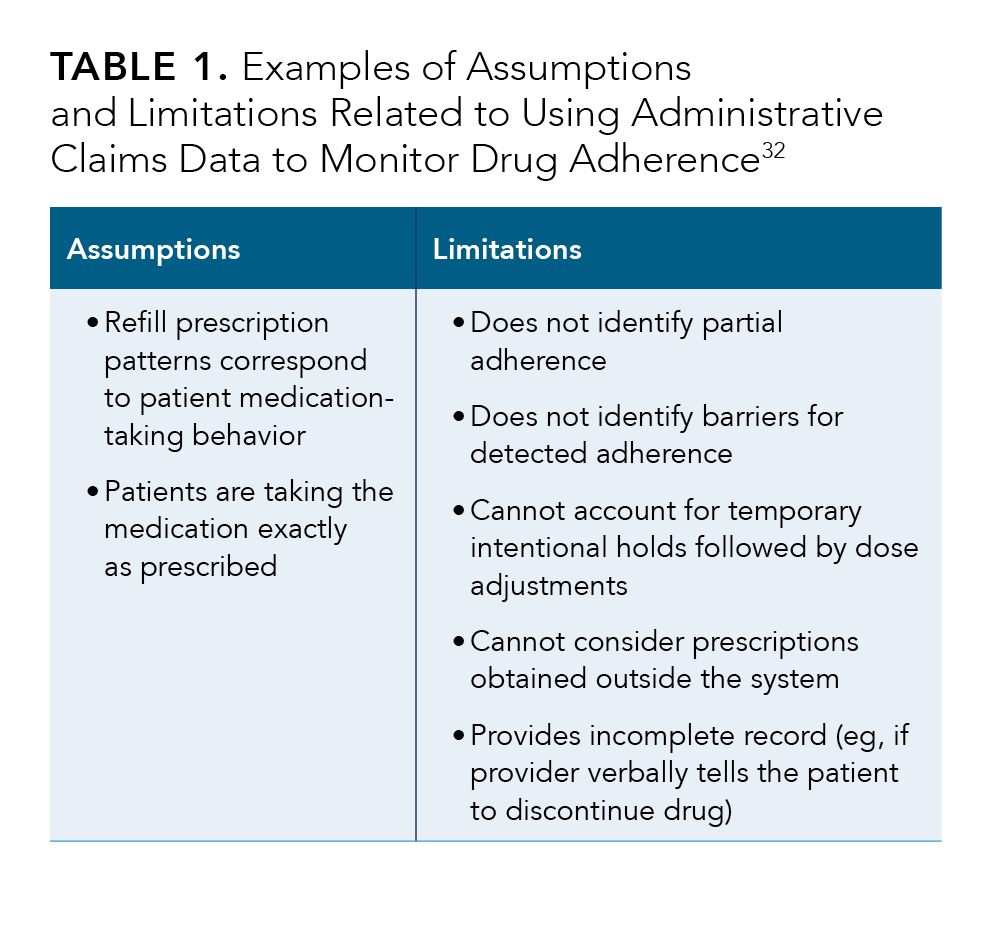
Monitoring drug adherence using administrative claims data is a type of analysis that makes many assumptions and cannot account for several important caveats (Table 1).32
Table 2.
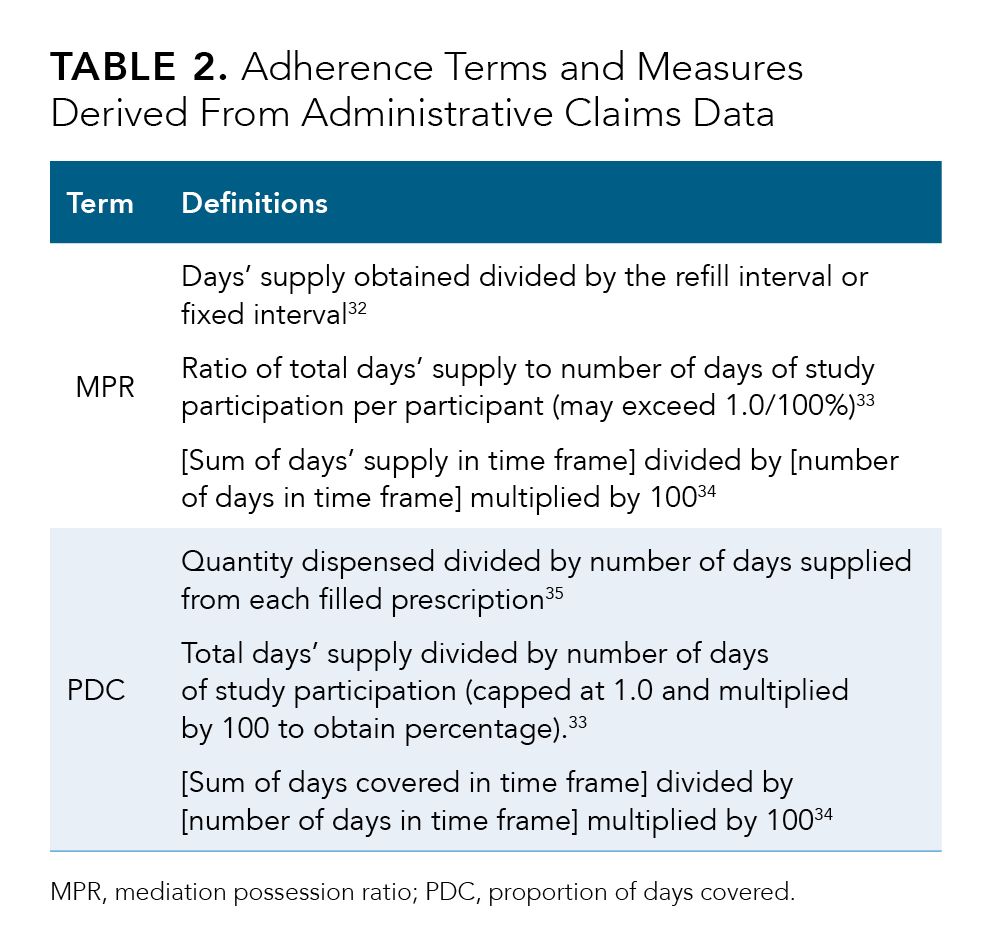
MPR and PDC are measures of adherence often used in studies that analyze only administrative claims data (Table 232-35). MPR is the most common measure used to estimate medication nonadherence; the next most common measure is PDC.36 Definitions of MPR and cutoff points that are used to define nonadherence often vary among studies, making it difficult to compare results. As Canfield and colleagues34 noted in their critique of MPR and PDC use in specialty pharmacy practice, “Although adherence metrics may serve as an internal benchmark to compare the progress of a program within an organization, caution is warranted for using them as an external benchmark to compare organizations.” In the rest of this white paper, we will focus on MPR.
Using MPR as a quality metric
As summarized in the Introduction, much has been said about how PBMs’ DIR fees have driven up costs for Medicare, patients, and pharmacy providers (including retail pharmacies, specialty pharmacies, and physician-run medical practices that have retail pharmacies or dispensing facilities).3,4,6,17,37-41 A less discussed but also very impactful facet of this issue is the use of MPR as a quality indicator for pharmacies dispensing oral oncolytics.34,42
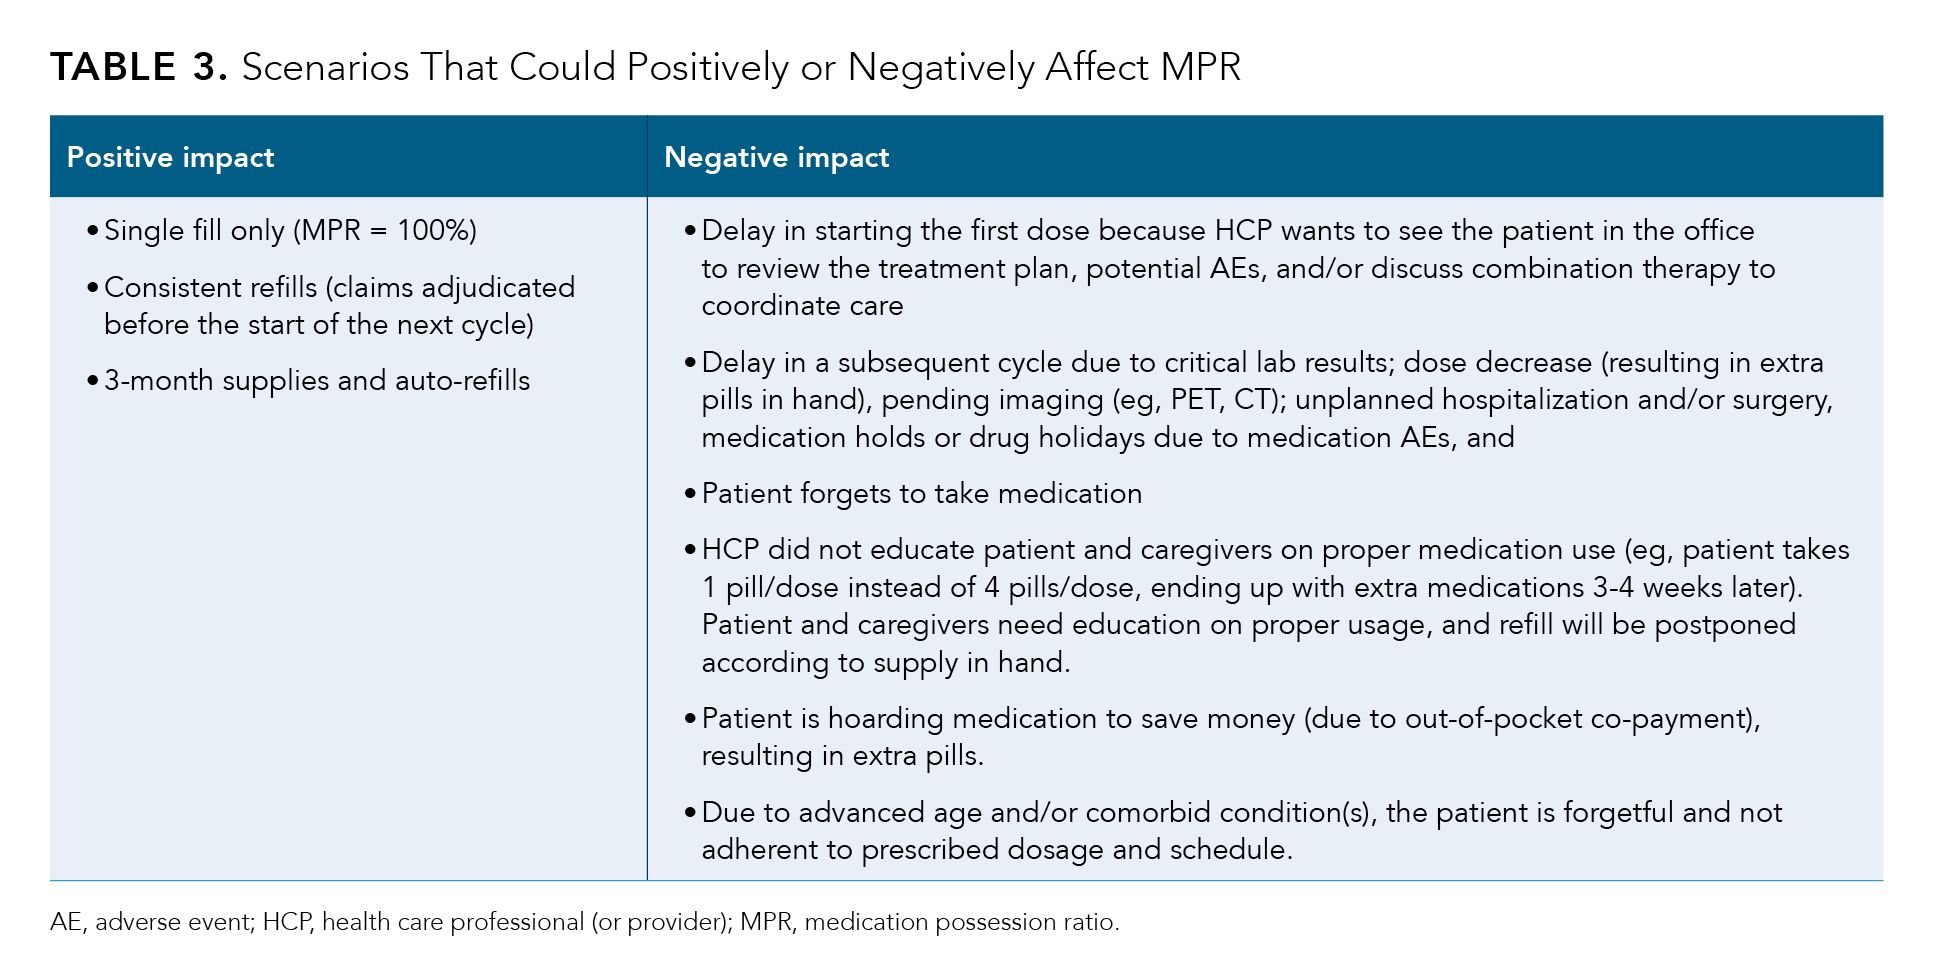
A threshold of MPR greater than or equal to 0.80 (ie, 80% or more) is considered to indicate that patients are adherent to their prescribed medication.43-45 However, MPR may be impacted by many variables that administrative claims data are not designed to track (Table 3). Negative impact on MPR falls into 2 categories: controllable and uncontrollable.
Controllable negative impacts can be avoided with good patient education, consistent follow-up, and AE management support. Examples of uncontrollable negative impacts include disease progression, the need for drug holidays, and hospitalizations.
Access to financial assistance from the start is crucial for supporting adherence to therapy and avoiding financial toxicities caused by burdensome out-of-pocket expenses. Patient-centric approaches, multidisciplinary approaches, and working with the patient’s caregiver or family all contribute to better patient care.
Lingering questions about the applicability of MPR analyses include as follows:
- Can MPR measurements be applied equally to every type of cancer (or other chronic disease) based on severity of the treated condition?
- Can MPR account for the different pharmacologic characteristics of agents used?
- Can MPR account for the severity of the treated condition?
Table 3.
What Data Support Our Multifaceted Alternative to MPR?
Instead of relying solely on MPR as the quality metric for specialty pharmacy performance, we at Rx To Go advocate using a multifaceted system to comprehensively evaluate the services we provide to patients with cancer who are receiving treatment with oral oncolytics. Thus, to better define and assess how we care for patients, we have developed tools such as patient and prescriber satisfaction surveys, pharmacy QPM scorecards, and our drug waste management program. In addition, Drug Performance Scorecards help create health-outcomes analyses with a focus on improving clinical programs and ultimately our main metrics. These important tools and program are discussed in the following sections.
Rx To Go as an in-house specialty pharmacy case study
Figure 1.
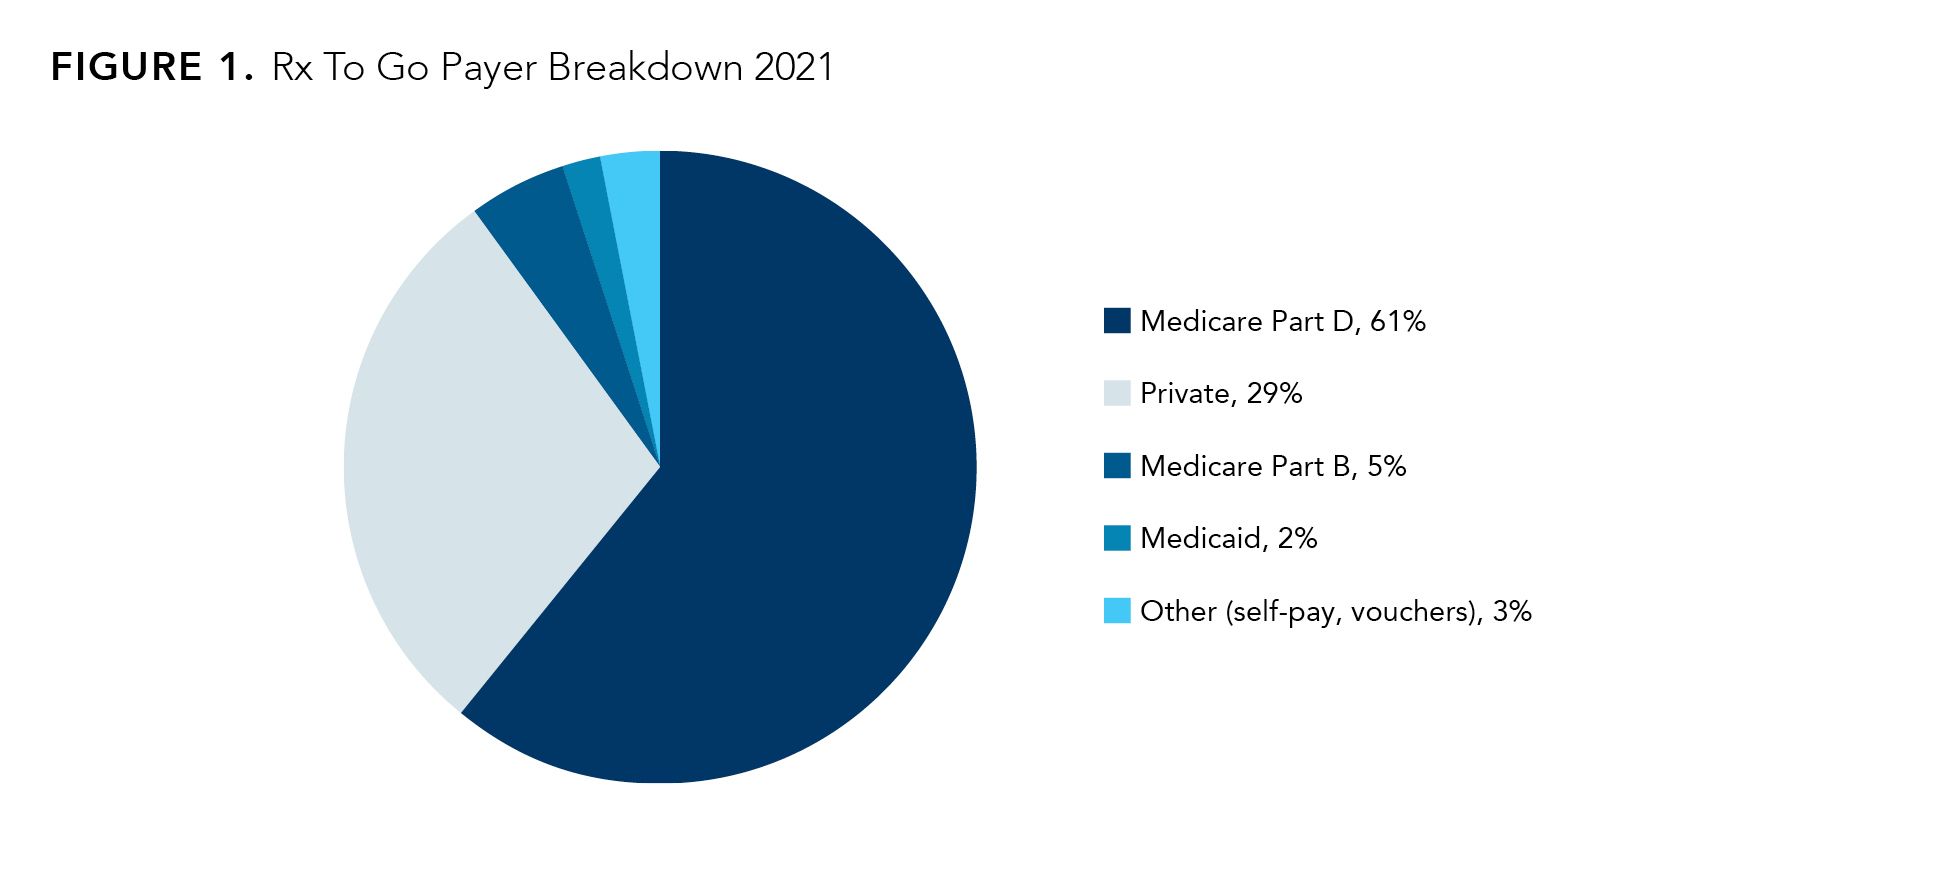
Rx To Go is accredited by 3 specialty pharmacy organizations and is designated as an extension of practice—with full access to patients’ EHRs and to a multidisciplinary team of physicians, nurses, and dieticians—to provide exceptional customer service for patients and caregivers. Rx To Go benefits for patients include coordination with their provider, monitoring and review of clinical laboratory values, therapy support, and adherence monitoring, as well as services related to insurance coverage, billing, medication costs, and financial assistance. Figure 1 shows the breakdown of payers for patients enrolled in Rx To Go.
QPM Scorecards
Our Rx To Go overall pharmacy QPM scorecard tool (Table 4) expands upon the standard metrics required by the accreditation bodies and reflects the most essential points of successful pharmacy operation: time to first fill, MPR, PDC, adherence program patient enrollment, and patient and prescriber (customer) satisfaction metrics. This QPM scorecard applies only to pharmacy performance. The Rx To Go Quality Management committee reviews these metrics at the end of each quarter.
Table 4.
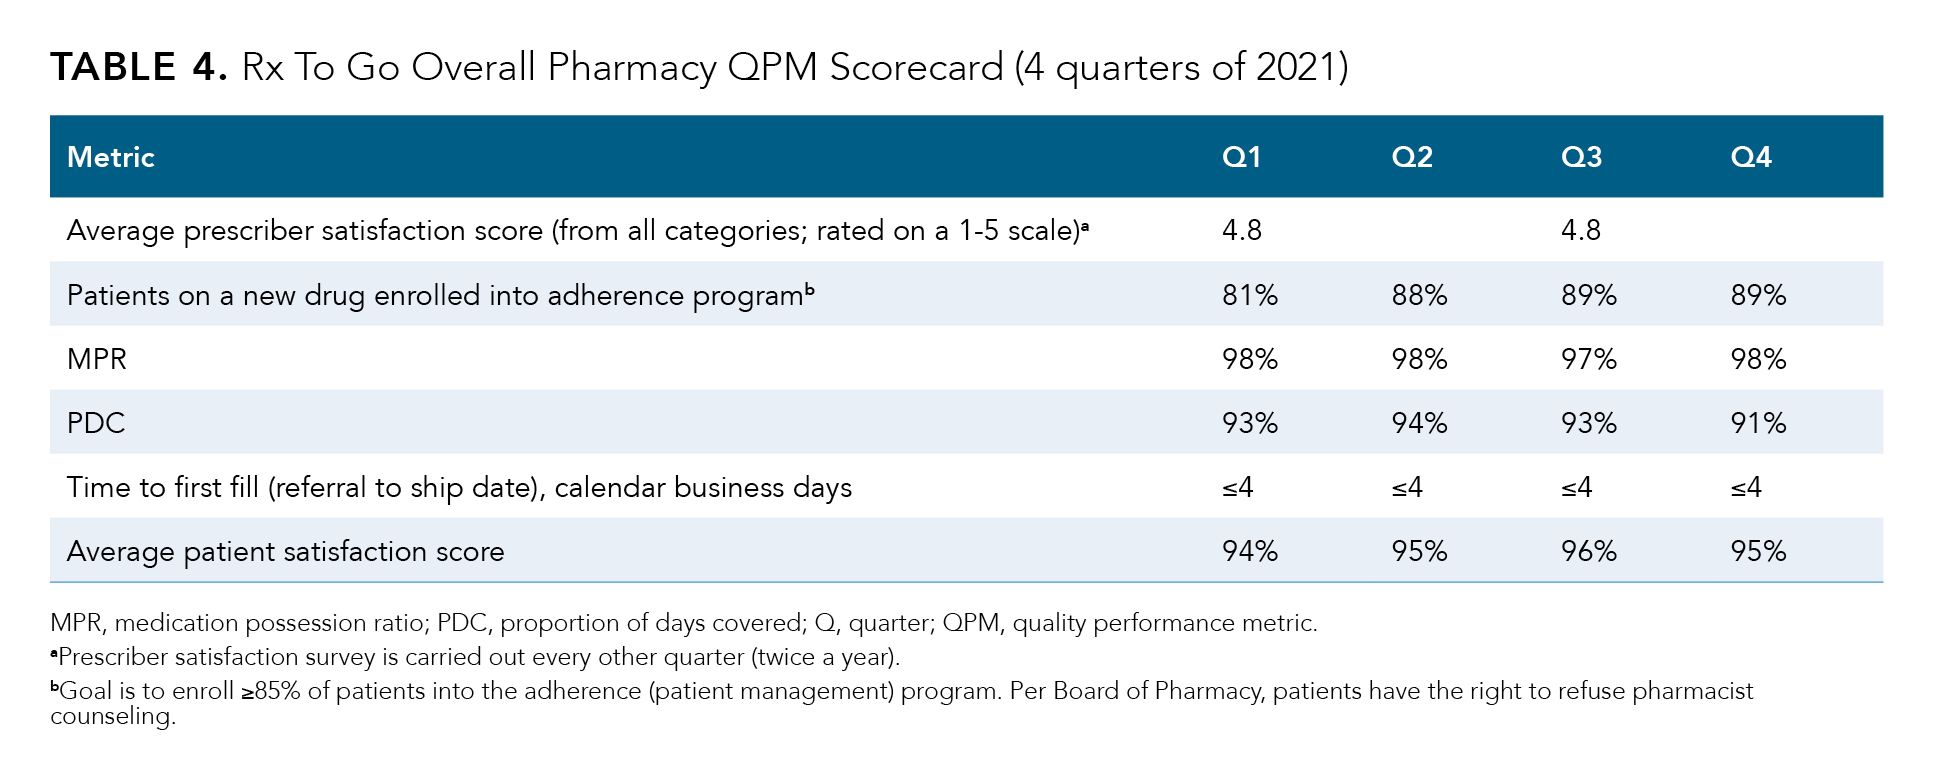
Time to first fill involves multiple factors from different services we provide; these range from benefits verification, prior authorization, and patient financial assistance to the initial shipment and contact with the patient. These services are important because they influence how fast a patient can start therapy and assist patients with any financial hardship that occurs in their cancer journey. The ideal goal of time to first fill is within the first 4 to 7 days of the first prescription submitted to the pharmacy. Rx To Go’s adherence program is important in that it educates patients on what to expect; describes how to manage drug- and disease-related AEs, and why it is crucial to address any issues sooner rather than later; and provides frequent reassessments with the patient and the patient’s chart. Addressing AEs as soon as possible can help to improve patient persistence in therapy and achieve desired clinical outcomes.
In 2013, Rx To Go designed and implemented a pharmacist-led patient education and AE management program that proved to be a highly successful. Khrystolubova and colleagues46 published an analysis of the program’s impact on the management of patients taking oral afatinib (Gilotrif) for the treatment of EGFR-mutated NSCLC in a real-world community oncology clinic. The findings show the value of pharmacist-led continuous follow-up, support, and education reinforcement to reduce AEs and help patients stay on treatment, supporting patients’ adherence to therapy.
Patient and prescriber satisfaction surveys
Customer satisfaction surveys are a crucial tool to obtain feedback and to engage patients and prescribers. These surveys are key for evaluating Rx To Go performance from the perspective of the patients and prescribers who use our services. Although these tools are primarily numeric, they include sections that allow survey responders to input comments.
Our goal at Rx To Go is to maintain an average patient satisfaction score of 95% or higher and an average prescriber satisfaction score of at least 4.5 on a 1-to-5 scale. There is no industry-standard goal to describe perfect patient satisfaction. We chose to hold ourselves to very high standards by aiming for at least 95% patient satisfaction. As reported, the Rx To Go patient satisfaction score is multilayered and encompasses net promoter score, satisfaction on the level of financial responsibilities (eg, patient financial assistance), patient counseling and knowledgeable pharmacist staff, customer service (eg, empathy), and timely medication deliveries. The Rx To Go provider satisfaction score assesses clinical support, professionalism, customer service, and timely communications.
In 2020 and 2021, Rx To Go maintained a median 95% (range, 94%-96%) overall patient satisfaction score, with lower scores for satisfaction with financial assistance (range, 88%-94%) and timely deliveries (range, 93%-96%). Our prescriber satisfaction score remains above 4.5.
Drug Waste Management Program
Another example of Rx To Go’s successful operations is the drug waste management program. Prevention of drug waste not only reduces patient and payer costs, but also averts potential treatment issues that might impact patient health outcomes. As noted by ASCO:
“There is growing concern that PBMs may be contributing to costly waste in cancer care. ASCO members have described situations in which a PBM sent the wrong dosage or type of medication or sent medication directly to a patient’s home, only to have it expire before they are able to get to their physician’s office. Each mistake and wasted vial of cancer medication represents an important expense for a cancer patient and a lost opportunity for appropriate treatment.”6
Figure 2.
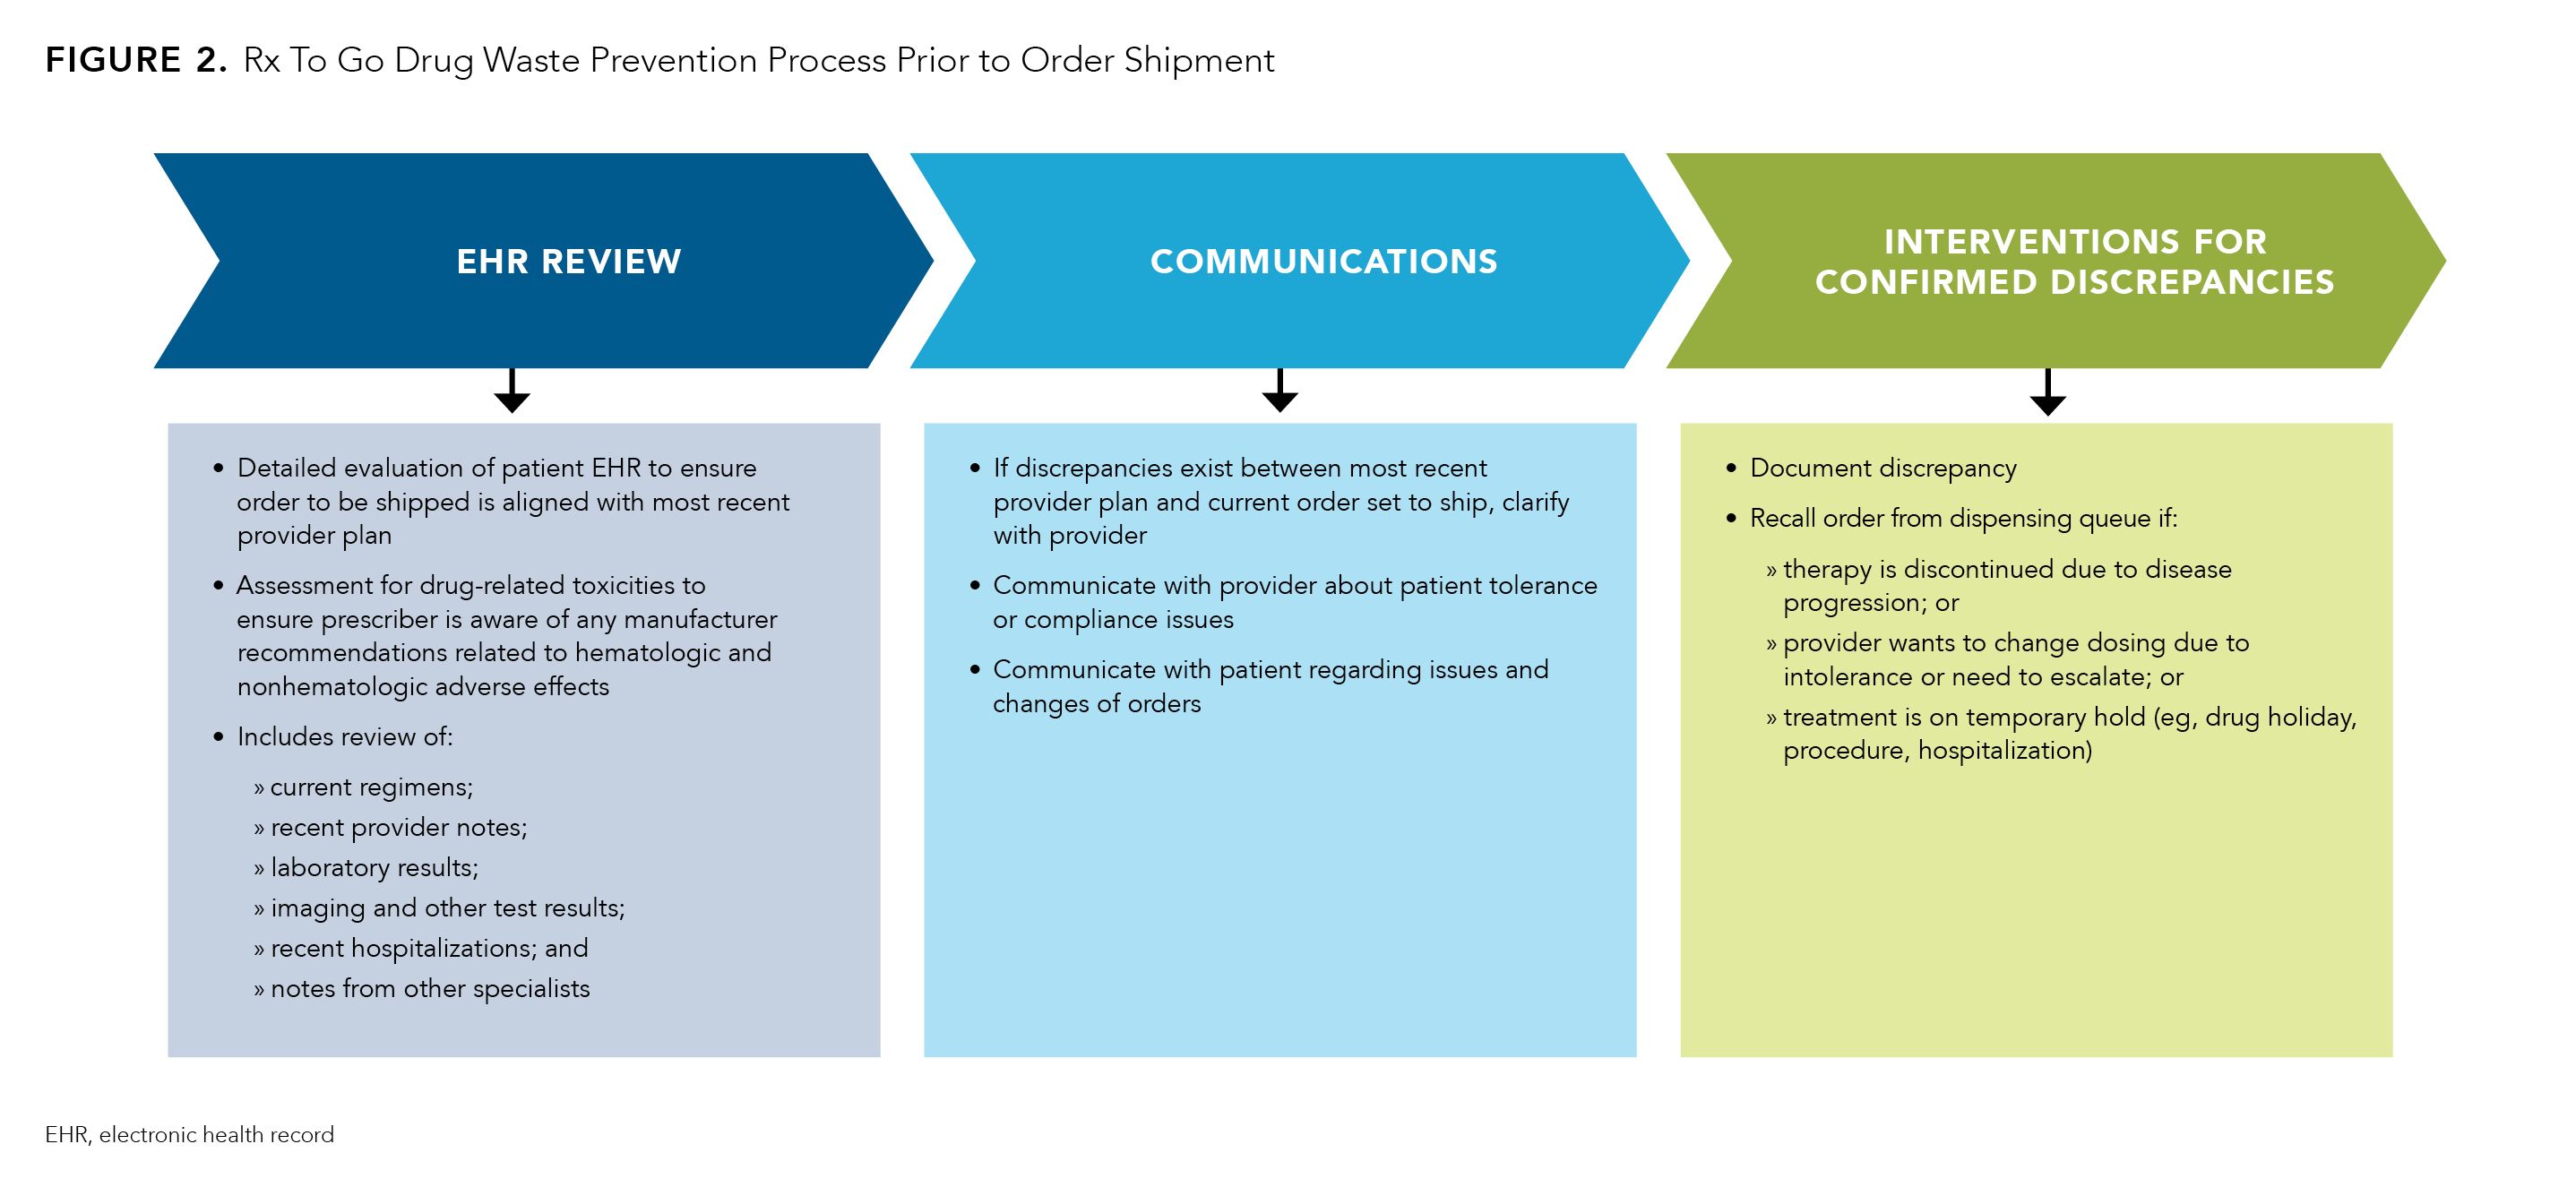
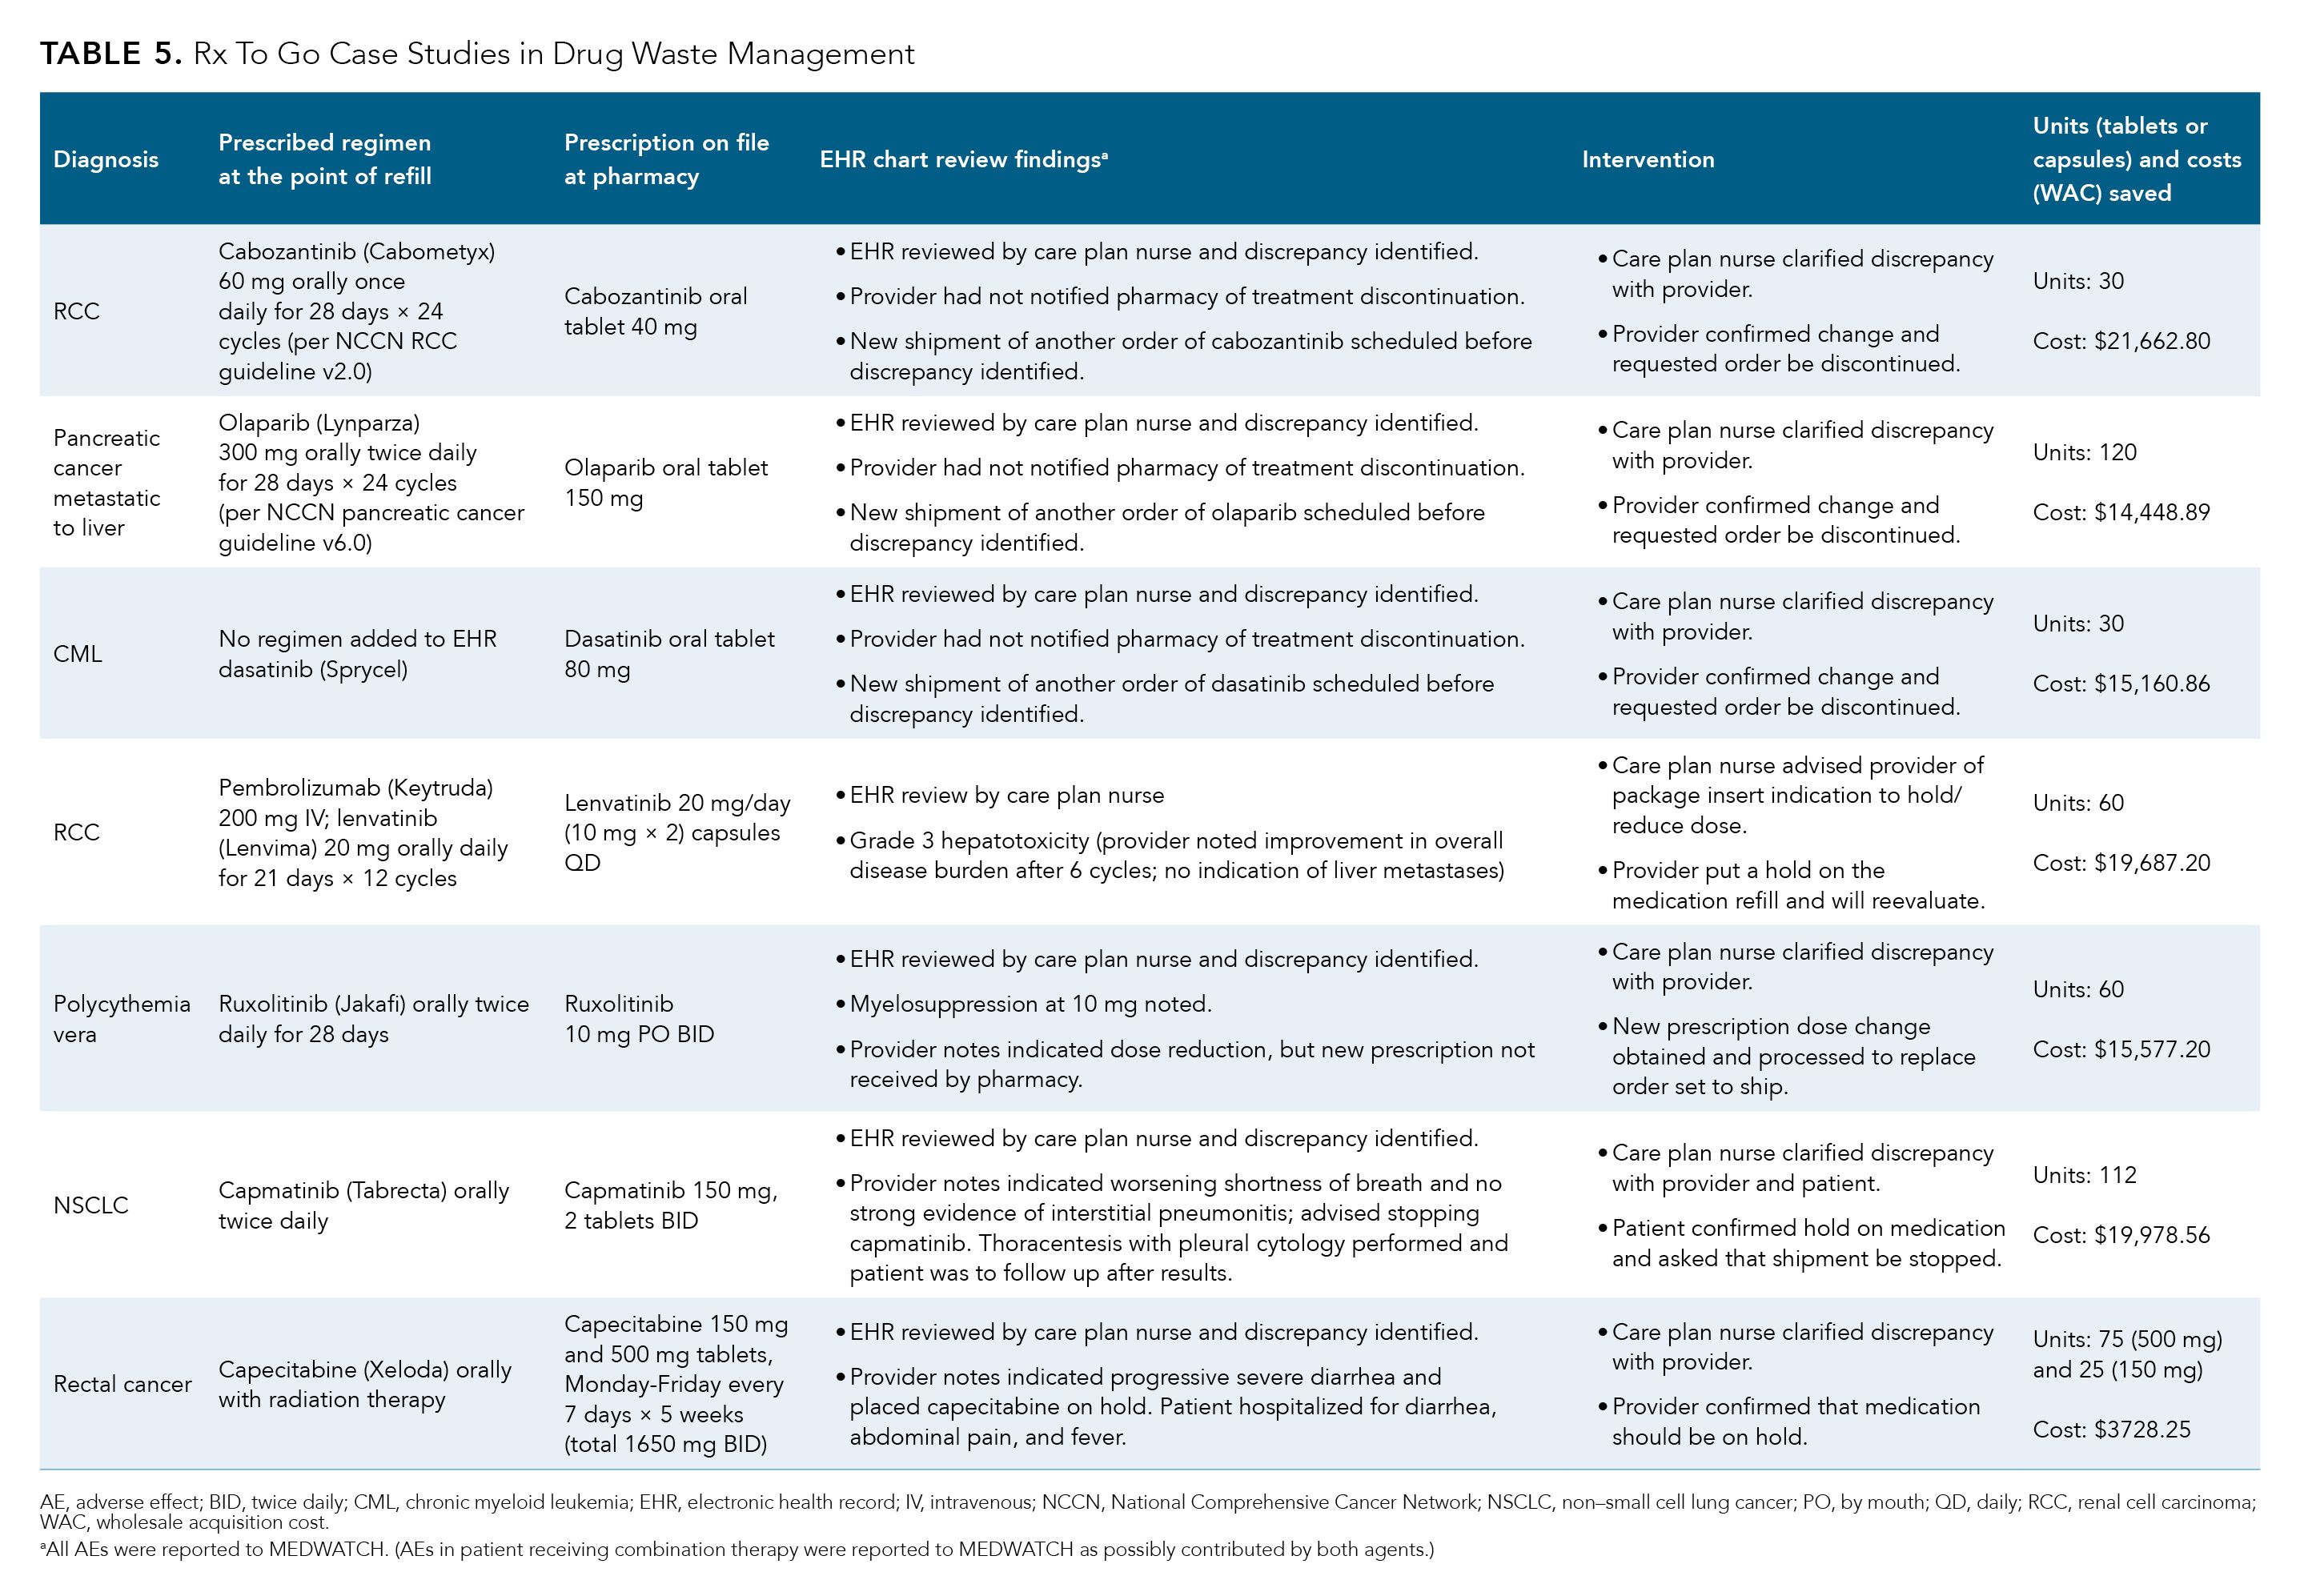
The tactics that we at Rx To Go use to prevent drug waste include detailed review of all new prescriptions upon their receipt from a provider and final review of every order (including refills of the original prescription) before shipment to the patient (Figure 2). These reviews are performed by a team of highly trained registered nurses and pharmacists. Table 5 summarizes several case studies that illustrate the effectiveness of the process we use to minimize and prevent drug waste.
Table 5.
Drug Performance Scorecards As a Tool to Improve Pharmacy Performance
A patient’s cancer journey is often unpredictable. From tackling treatment issues to addressing financial barriers, we at Rx To Go wanted to be able to showcase our ability to provide the same or better level of service than other specialty pharmacies. Thus, in addition to the overall pharmacy QPM scorecard, Rx To Go developed and incorporated into practice individual Drug Performance Scorecards, which summarize clinical outcome metrics as well as analyses of persistence on therapy and reasons for discontinuation. These drug-specific metrics allow our pharmacy to measure goals and outcomes, and to identify challenges. Here, we summarize the Drug Performance Scorecard data for 3 oral oncolytics—dasatinib (Sprycel), palbociclib (Ibrance), and ibrutinib (Imbruvica)—prescribed to Medicare patients enrolled in Rx To Go over the course of 4 quarters (July 2020-June 2021).
Dasatinib scorecard
During the 12-month analysis period, approximately 47% of Medicare patients enrolled in Rx To Go received dasatinib prescriptions (Table 6). On average per quarter, 6 new patients started dasatinib therapy and Rx To Go filled an average of 65% of all the scripts received. The remaining orders that were received were transitioned to manufacturer-sponsored free medication programs or transferred to another specialty pharmacy. Due to selection of different treatment options, patients’ preferences, and other external circumstances, 1% of orders were canceled/discontinued before the patient began taking the drug.
Table 6.
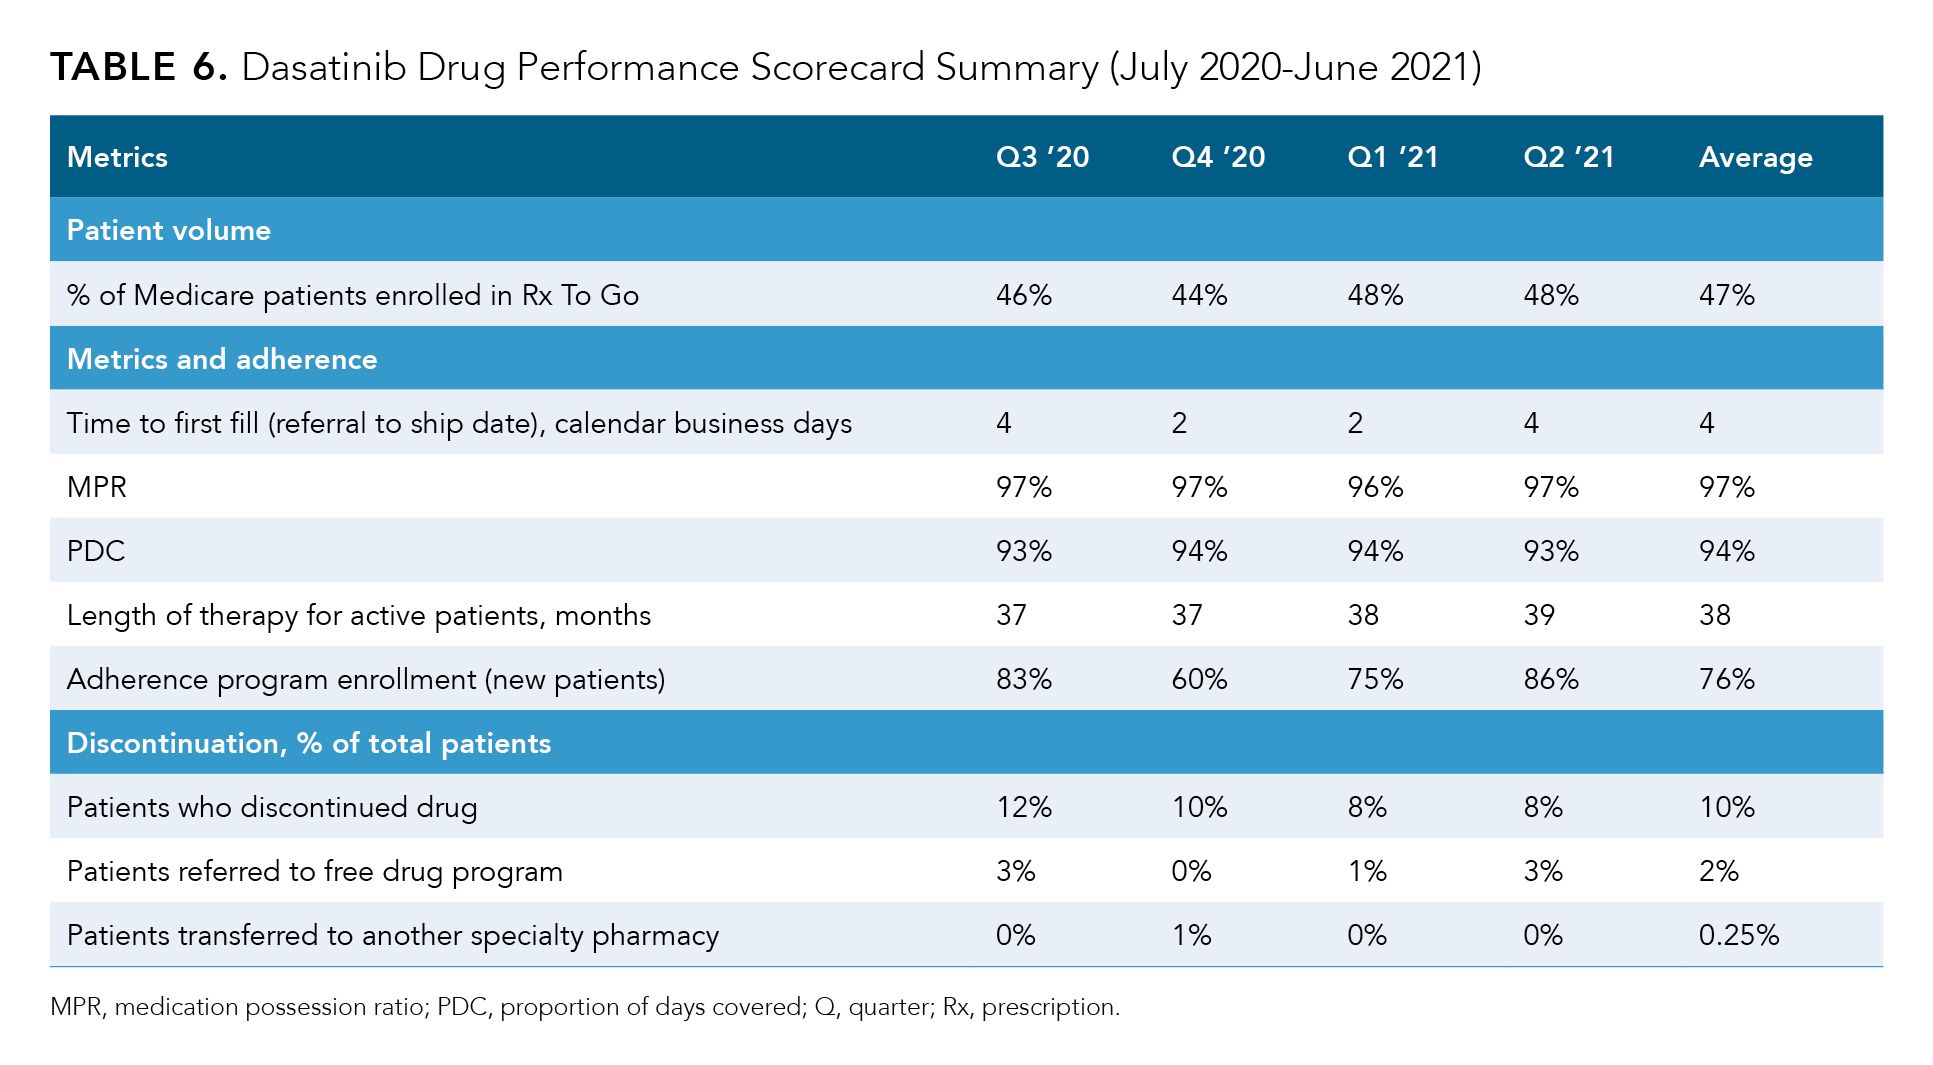
The average time to first fill for any new dasatinib order was approximately 3 days. Among all the patients who were serviced by Rx To Go during the 4 studied quarters, only 10% were discharged from the pharmacy. This included 24 patients who discontinued because of a clinical or other reason, 5 patients who were discharged to the manufacturer for free drug, and 1 patient who was transferred to another specialty pharmacy. Among the 24 patients who were discontinued for a clinical or other reason, 4 patients died, 5 left the practice, 1 had disease progression, 1 followed National Comprehensive Cancer Network recommendations, and 14 experienced AEs. Of the 14 patients who discontinued due to AEs, 85% discontinued due to pleural effusion and 15% discontinued due to peripheral edema, lack of energy, and/or diarrhea. Overall, Rx To Go maintained an average MPR of 97%, average PDC of 94%, and average length of therapy of 38 months for patients with dasatinib prescriptions during each analyzed quarter.
Palbociclib scorecard
During the 12-month analysis period, approximately 64% of Medicare patients enrolled in Rx To Go received palbociclib prescriptions (Table 7). On average, we had 34 new patients on palbociclib each quarter and were able to fill prescriptions for 67% of these patients per quarter. As mentioned for the dasatinib analysis, the remaining received orders were transferred to manufacturer-sponsored free drug programs or to another specialty pharmacy.
Table 7.
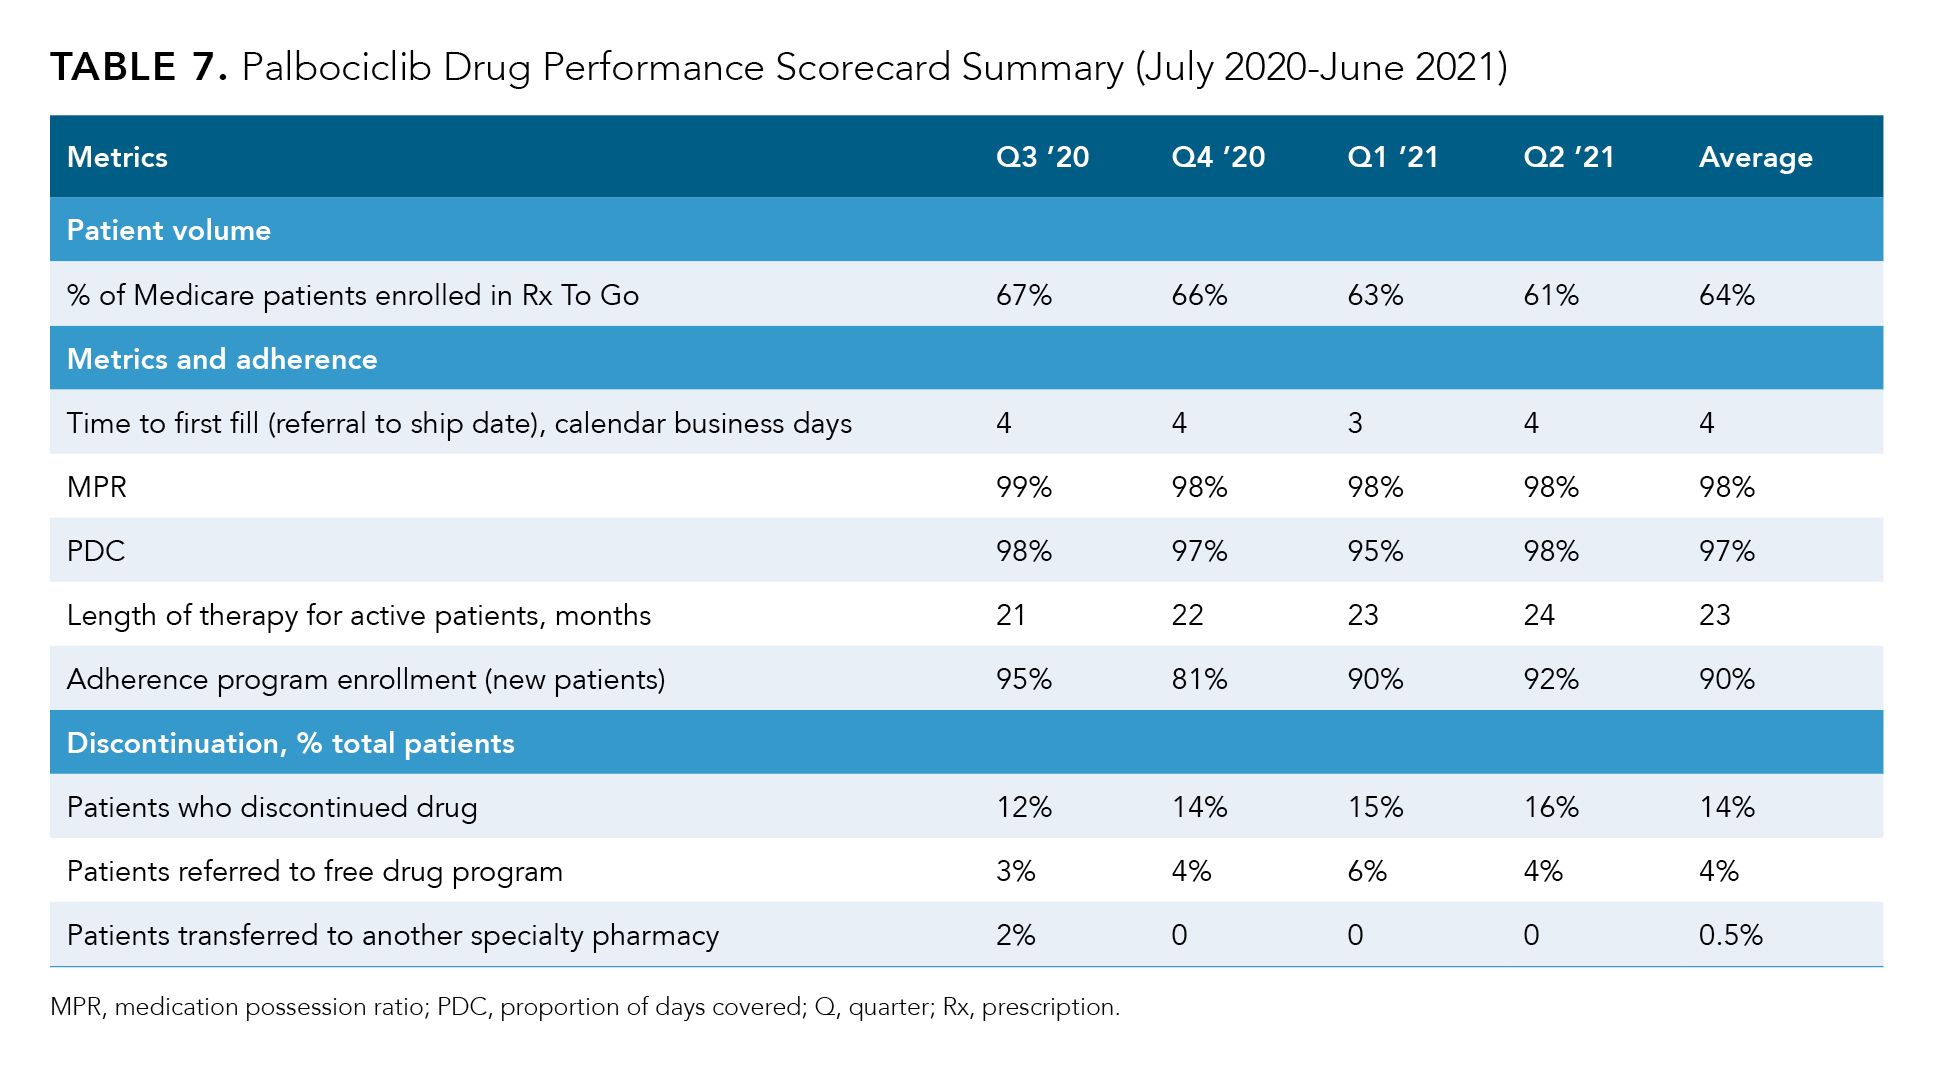
The average time to first fill for any new palbociclib order was approximately 4 days. Among all patients to whom Rx To Go dispensed palbociclib during the 4 analyzed quarters, only 14% were discharged from our pharmacy. The discharged patients included 127 patients who discontinued palbociclib due to a clinical or other reason, 59 patients who were discharged to the manufacturer for free drug, and 5 patients who went to another specialty pharmacy.
Of the patients who were discontinued due to a clinical or other reason, 15 patients died, 79 had disease progression, 10 left the practice, 2 had other comorbidities, and 20 had AEs. Permanent discontinuation associated with an AE occurred in 20 of 1352 (1.4%) patients receiving palbociclib during the 4 quarters. Most of these AEs were cytopenias, fatigue, and diarrhea. In contrast, permanent discontinuation associated with AEs occurred in 9.7% of palbociclib-treated patients in the PALOMA-2 trial47 and 4% of palbociclib-treated patients in the PALOMA-3 trial.48
Reflecting the high enrollment rate in the Rx To Go adherence program, the average length of therapy for each patient was an impressive 22.5 months. Other metrics indicating high adherence included the high MPR (98%-99%) and PDC (95%-98%) rates, as well as other benchmarks showcased in this scorecard. We believe that every element is a factor in providing care of exceptional quality to every patient at Rx To Go.
Ibrutinib scorecard
Among patients prescribed ibrutinib, Rx To Go serviced about 76% of the Medicare population and we admitted approximately 42 new patients each quarter (Table 8). The average time to first fill from order receipt was 4.2 days.
Table 8.
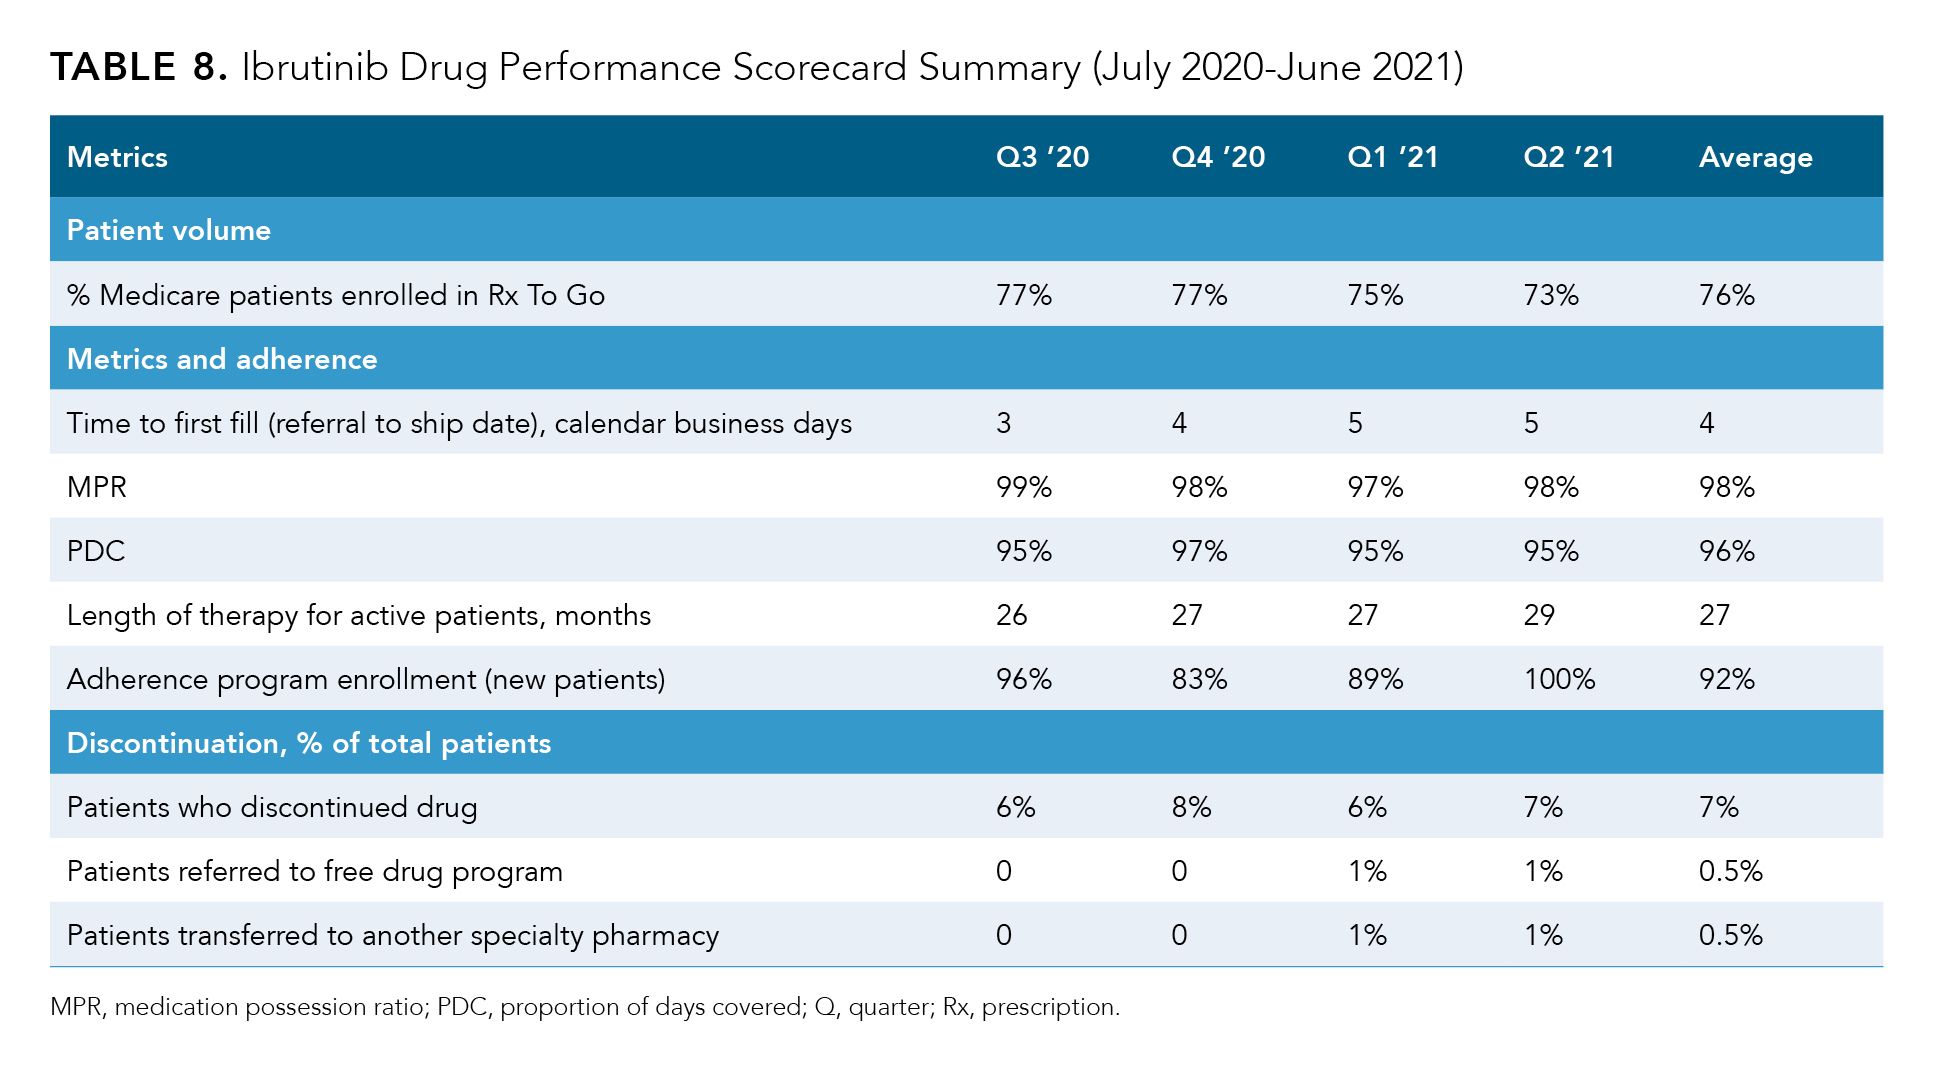
Approximately 7% of patients were discontinued due to a clinical reason, an insurance mandate, or a free drug program. This included 139 seasonal patients and those who discontinued due to disease progression, death, AEs, leaving the practice, or observation. Observation in this disease state was defined as a patient who, based on their age/comorbidities, discontinued after obtaining an adequate response for a minimum of 12 months. Our Rx To Go patient population is much older and has more comorbidities compared with participants in most clinical trials. Currently, 8% of our patients are being observed.
Thirty-four percent of patients had discontinued ibrutinib due to an AE such as cytopenias, bleeding, diarrhea, fatigue, edema, hypertension, and atrial fibrillation. Twenty percent of patients discontinued due to disease progression and 18% of patients had died, 14% of patients had left the practice, and 6% of patients were seasonal.
Applications of Scorecards
The Rx To Go pharmacy QPM scorecards that we have developed help demonstrate, in a real-world scenario, pharmacy excellence in helping patients navigate their difficult cancer journey. As a specialized pharmacy, we successfully provide timely prescription deliveries, patient-centric support, patient financial support, and provider support, ensuring that no disruptions in treatments occur.
Our Rx To Go Drug Performance scorecards help to identify challenges and to improve interventions and processes; thus, improving on persistence on therapy is defined as the act of continuing treatment for the prescribed duration.49 The 3 oral oncolytics discussed in this article are associated with a high risk of AEs, which result in more than 20% of patients experiencing dose interruptions and discontinuation. With these scorecards’ provision of persistency data, reasons for discontinuation, and the percentage of patients who have enrolled in the Rx To Go adherence program, we are able to showcase Rx To Go’s practice success. We also continue to learn and improve from these metrics. Identifying the clinical reasons for discontinuations based on AEs provides opportunities to enhance Rx To Go patient management programs.
Patient persistence of therapy is the most desirable metric upon which to measure adherence on therapy and outcomes. Typically, the only available benchmark for patient persistence on therapy in oncology would be a clinical trial, but the populations enrolled in clinical trials are often different from real-world populations and they vary state by state. Many of the patients we service at Rx To Go would never be enrolled in drug clinical trials because of comorbidities or previous therapies. In the real world, we treat all comers. According to our health outcomes studies, the Rx To Go patient population is, on average, approximately 10 to 12 years older than populations usually enrolled in interventional clinical trials. To address these challenges, pharmacies like ours must mobilize and create clinical programs and additional patient support that may not be factored at all into the clinical trials. Examples of additional support include financial assistance, oncology-trained dietitian services, and assistance with addressing drug-induced adverse reactions. These actions help us keep patients on effective therapy as long as possible.
CONCLUSIONS
As described in this paper, we at Rx To Go have identified the following predictive markers of successful patient management in our in-house, medically integrated, specialty oral oncology pharmacy practice:
- enrollment into patient management program under pharmacist supervision;
- time to first fill;
- MPR and PDC as measurements of continuous fills;
- persistence on therapy;
- patient satisfaction score;
- prescriber satisfaction score; and
- drug waste management programs.
Reporting more than MPR is essential to ensure that our Rx To Go pharmacy is providing care of exceptional quality, especially in oncology. MPR can be used to assess uninterrupted service during patient treatment but cannot encompass the complexity of patient care in oncology. Additional data such as persistency and length on therapy allow us to measure the quality of our interventions. Expanding on persistency data allows us to explore reasons for dose interruptions, changes, and discontinuation. The QPM and drug performance scorecards are a good way to display the real-world positive outcomes of all Rx To Go pharmacy interventions, from the prescription journey to the patient journey on their medications. In the future, this multimetric scorecard approach might serve as a standard way of benchmarking Rx To Go with other high-performing specialty pharmacies.
Our drug waste management program ensures that drug refills are based on a patient’s current clinical picture and disease state, as determined in collaboration with prescribers and utilizing immediate EHR access. Our multilayered patient and prescriber satisfaction surveys assess how well we perform in providing customer service to our patients and prescribers.
Author Information
All authors are affiliated with Florida Cancer Specialists and Research Institute. Natasha Khrystolubova, RPh, BPharm, BCOP, is director, Pharmacy Clinical Services; Ray Bailey, RPh, is senior vice president, Pharmacy Services; Roger Orr, PharmD, BCOP, is associate director, Pharmacy Clinical Services; Lucio N. Gordan, MD, is chief medical officer; and Trista Auger, RPhT, CPhT, is health outcomes assistant.
Acknowledgments and Funding Sources
The authors thank Monica Nicosia, PhD, and Phillips Gilmore Oncology Communications, Inc, for medical writing, editorial, and graphic design assistance funded by Community Oncology Alliance and Florida Cancer Specialists & Research Institute.
Ethics Approval and Informed Consent
All database records are statistically deidentified and certified to be fully compliant with US patient confidentiality requirements set forth in the Health Insurance Portability and Accountability Act of 1996. Because this study used only deidentified patient records and did not involve the collection, use, or transmittal of individually identifiable data, this study was exempted from Institutional Review Board approval.
REFERENCES
1. Frier Levitt, LLC. PBM DIR fees costing Medicare and beneficiaries: investigative white paper on background, cost impact, and legal issues. Community Oncology Alliance. January 2017. Accessed July 10, 2022. https://communityoncology.org/reports-and-publications/studies-and-reports/pbm-dir-fees-costing-medicare-and-beneficiaries-investigate-white-paper-on-background-cost-impact-and-legal-issues/
2. CMS, HHS. Medicare program; Medicare Advantage and prescription drug benefit programs: negotiated pricing and remaining revisions. Fed Regist. 2009;74(7):1494-1549. Accessed March 8, 2022. https://www.federalregister.gov/documents/2009/01/12/E9-148/medicare-program-medicare-advantage-and-prescription-drug-benefit-programs-negotiated-pricing-and
3. Medicare Part D — direct and indirect remuneration (DIR). CMS. January 19, 2017. Accessed May 3, 2021. https://www.cms.gov/newsroom/fact-sheets/medicare-part-d-direct-and-indirect-remuneration-dir
4. Frier Levitt, LLC. “Performance” based DIR fees: a rigged system with disparate effect on specialty pharmacies, Medicare Part D beneficiaries and the U.S. healthcare system. Community Oncology Alliance. March 1, 2017. Accessed April 30, 2021. https://communityoncology.org/performance-based-dir-fees-a-rigged-system-with-disparate-effect-on-specialty-pharmacies-medicare-part-d-beneficiaries-and-the-us-healthcare-system/
5. Frier Levitt, LLC. Pharmacy benefit manager exposé: how PBMs adversely impact cancer care while profiting at the expense of patients, providers, employers, and taxpayers. Community Oncology Alliance. February 2022. Accessed July 10, 2022. https://communityoncology.org/wp-content/uploads/2022/02/COA_FL_PBM_Expose_2-2022.pdf
6. American Society of Clinical Oncology position statement: pharmacy benefit managers and their impact on cancer care. American Society of Clinical Oncology. 2018. Accessed May 4, 2021. https://www.asco.org/sites/new-www.asco.org/files/content-files/advocacy-and-policy/ASCO-Position-Statement-PBMs-Aug.-2018.pdf
7. McCorkle R, Ercolano E, Lazenby M, et al. Self-management: enabling and empowering patients living with cancer as a chronic illness. CA Cancer J Clin. 2011;61(1):50-62. doi:10.3322/caac.20093
8. Accordino MK, Hershman DL. Disparities and challenges in adherence to oral antineoplastic agents. Am Soc Clin Oncol Educ Book. 2013;271-276. doi:10.14694/EdBook_AM.2013.33.271
9. Dean LT, George M, Lee KT, Ashing K. Why individual-level interventions are not enough: systems-level determinants of oral anticancer medication adherence. Cancer. 2020;126(16):3606-3612. doi:10.1002/cncr.32946
10. Patel K, Pagel JM. Current and future treatment strategies in chronic lymphocytic leukemia. J Hematol Oncol. 2021;14(1):69. doi:10.1186/s13045-021-01054-w
11. Reff MJ, Shillingburg A, Shah B, Elder C, Prescott H, Kennerly-Shah J. Front-line use of tyrosine kinase inhibitors in chronic phase chronic myeloid leukemia: practice considerations. J Oncol Pharm Pract. 2020;26(1):156-174. doi:10.1177/1078155219864640
12. Ruddy K, Mayer E, Partridge A. Patient adherence and persistence with oral anticancer treatment. CA Cancer J Clin. 2009;59(1):56-66. doi:10.3322/caac.20004
13. Shih JC, Olszanski AJ. Orally administered cancer therapy: breaking down barriers to adherence and quality of life. J Natl Compr Canc Netw. 2019;17(3):290-292. doi:10.6004/jnccn.2018.7284
14. Mackler E, Segal EM, Muluneh B, Jeffers K, Carmichael J. 2018 Hematology/Oncology Pharmacist Association best practices for the management of oral oncolytic therapy: pharmacy practice standard. J Oncol Pract. 2019;15(4):e346-e355. doi:10.1200/JOP.18.00581
15. Fajardo S, Zook F, Dotson E. Specialty pharmacy for hematologic malignancies. Am J Health Syst Pharm. 2016;73(11):797-809. doi:10.2146/ajhp150749
16. Wang AA, Tapia C, Bhanji Y, et al. Barriers to receipt of novel oral oncolytics: a single-institution quality improvement investigation. J Oncol Pharm Pract. 2020;26(2):279-285. doi:10.1177/1078155219841424
17. Royce TJ, Schenkel C, Kirkwood K, Levit L, Levit K, Kircher S. Impact of pharmacy benefit managers on oncology practices and patients. JCO Oncol Pract. 2020;16(5):276-284. doi:10.1200/JOP.19.00606
18. Dillmon MS, Kennedy EB, Anderson MK, et al. Patient-centered standards for medically integrated dispensing: ASCO/NCODA standards. J Clin Oncol. 2020;38(6):633-644. doi:10.1200/JCO.19.02297
19. Egerton NJ. In-office dispensing of oral oncolytics: a continuity of care and cost mitigation model for cancer patients. Am J Manag Care. 2016;22(4 suppl):S99-S103.
20. Wimbiscus B. The benefits of medically integrated dispensing for cancer drugs. Targeted Oncology. January 17, 2019. Accessed September 28, 2021. https://www.targetedonc.com/view/the-benefits-of-medically-integrated-dispensing-for-cancer-drugs
21. NCODA announces the defining of the medically integrated dispensing pharmacy. News release. NCODA; January 27, 2020. Accessed March 8, 2022. https://www.ncoda.org/medically-integrated-dispensing-pharmacy/
22. Barbor M. Medically integrated pharmacy care improves patient satisfaction and outcomes. Oncology Practice Management. 2020;10(7). Accessed March 9, 2022. https://oncpracticemanagement.com/issues/2020/july-2020-vol-10-no-7/1665-medically-integrated-pharmacy-care-improves-patient-satisfaction-and-outcomes
23. Dillmon MS, Kennedy EB, Reff M. Patient-centered medically integrated dispensing: ASCO/NCODA standards summary. JCO Oncol Pract. 2020;16(6):344-347. doi:10.1200/OP.19.00668
24. Howard A, Kerr J, McLain M, Modlin J. Financial impact from in-office dispensing of oral chemotherapy. J Oncol Pharm Pract. 2019;25(7):1570-1575. doi:10.1177/1078155218799853
25. Academia EC, Mejías-De Jesús CM, Stevens JS, et al. Adherence to oral oncolytics filled through an internal health-system specialty pharmacy compared with external specialty pharmacies. J Manag Care Spec Pharm. 2021;27(10):1438-1446. doi:10.18553/jmcp.2021.27.10.1438
26. Adherence to long-term therapies: evidence for action. World Health Organization. 2003. Accessed April 30, 2021. http://apps.who.int/iris/bitstream/handle/10665/42682/9241545992.pdf
27. Burnier M. Is there a threshold for medication adherence? lessons learnt from electronic monitoring of drug adherence. Front Pharmacol. 2018;9:1540. Published January 9, 2019. doi:10.3389/fphar.2018.01540
28. Choudhry NK, Kronish IM, Vongpatanasin W, et al; American Heart Association Council on Hypertension; Council on Cardiovascular and Stroke Nursing; and Council on Clinical Cardiology. Medication adherence and blood pressure control: a scientific statement from the American Heart Association. Hypertension. 2022;79(1):e1-e14. doi:10.1161/HYP.0000000000000203
29. Greer JA, Amoyal N, Nisotel L, et al. A systematic review of adherence to oral antineoplastic therapies. Oncologist. 2016;21(3):354-376. doi:10.1634/theoncologist.2015-0405
30. Burnier M, Wuerzner G, Struijker-Boudier H, Urquhart J. Measuring, analyzing, and managing drug adherence in resistant hypertension. Hypertension. 2013;62(2):218-225. doi:10.1161/HYPERTENSIONAHA.113.00687
31. Blankart KE, Lichtenberg FR. Are patients more adherent to newer drugs? Health Care Manag Sci. 2020;23(4):605-618. doi:10.1007/s10729-020-09513-5
32. Lam WY, Fresco P. Medication adherence measures: an overview. Biomed Res Int. 2015;2015:217047. doi:10.1155/2015/217047
33. Hess LM, Raebel MA, Conner DA, Malone DC. Measurement of adherence in pharmacy administrative databases: a proposal for standard definitions and preferred measures. Ann Pharmacother. 2006;40(7-8):1280-1288. doi:10.1345/aph.1H018
34. Canfield SL, Zuckerman A, Anguiano RH, et al. Navigating the wild west of medication adherence reporting in specialty pharmacy. J Manag Care Spec Pharm. 2019;25(10):1073-1077. doi:10.18553/jmcp.2019.25.10.1073
35. Benner JS, Glynn RJ, Mogun H, Neumann PJ, Weinstein MC, Avorn J. Long-term persistence in use of statin therapy in elderly patients. JAMA. 2002;288(4):455-461. doi:10.1001/jama.288.4.455
36. Cutler RL, Fernandez-Llimos F, Frommer M, Benrimoj C, Garcia-Cardenas V. Economic impact of medication non-adherence by disease groups: a systematic review. BMJ Open. 2018;8(1):e016982. doi:10.1136/bmjopen-2017-016982
37. O’Reilly KB. Time to scrutinize PBMs’ outsized role in Rx decision-making. American Medical Association. June 10, 2019. Accessed May 4, 2021. https://www.ama-assn.org/delivering-care/public-health/time-scrutinize-pbms-outsized-role-rx-decision-making
38. Van Nuys K, Joyce G, Ribero R, Goldman DP. Frequency and magnitude of co-payments exceeding prescription drug costs. JAMA. 2018;319(10):1045-1047. doi:10.1001/jama.2018.0102
39. Anderson GF, Bai G. Reforming direct and indirect remuneration in Medicare Part D. Health Affairs. February 19, 2019. Accessed May 4, 2021. https://www.healthaffairs.org/do/10.1377/forefront.20190215.708286/full/
40. Kruczek N. Easy reading: direct and indirect remuneration fees. Pharmacy Times. July 21, 2020. Accessed May 4, 2021. https://www.pharmacytimes.com/view/easy-reading-direct-and-indirect-remuneration-fees.
41. Gabay M. Direct and indirect remuneration fees: the controversy continues. Hosp Pharm. 2017;52(11):740-741. doi:10.1177/0018578717739633
42. Rupp MT. Assessing the quality of pharmacy care: it’s not about adherence. J Manag Care Spec Pharm. 2019;25(10):1046-1047. doi:10.18553/jmcp.2019.25.10.1046
43. Tang KL, Quan H, Rabi DM. Measuring medication adherence in patients with incident hypertension: a retrospective cohort study. BMC Health Serv Res. 2017;17(1):135. doi:10.1186/s12913-017-2073-y
44. Sackett DL, Haynes RB, Gibson ES, et al. Randomised clinical trial of strategies for improving medication compliance in primary hypertension. Lancet. 1975;305(7918):1205-1207. doi:10.1016/s0140-6736(75)92192-3
45. Karve S, Cleves MA, Helm M, Hudson TJ, West DS, Martin BC. Good and poor adherence: optimal cut-point for adherence measures using administrative claims data. Curr Med Res Opin. 2009;25(9):2303-2310. doi:10.1185/03007990903126833
46. Khrystolubova N, Shieh M, Patel AJ, Bailey R. Pharmacist-led patient education and adverse event management in patients with non-small cell lung cancer receiving afatinib in a community-based, real-world clinical setting. J Oncol Pharm Pract. 2020;26(1):13-22. doi:10.1177/1078155219833441
47. Finn RS, Martin M, Rugo HS, et al. Palbociclib and letrozole in advanced breast cancer. N Engl J Med. 2016;375(20):1925-1936. doi:10.1056/NEJMoa1607303
48. Cristofanilli M, Turner NC, Bondarenko I, et al. Fulvestrant plus palbociclib versus fulvestrant plus placebo for treatment of hormone-receptor-positive, HER2-negative metastatic breast cancer that progressed on previous endocrine therapy (PALOMA-3): final analysis of the multicentre, double-blind, phase 3 randomised controlled trial. Lancet Oncol. 2016;17(4):425-439. doi:10.1016/S1470-2045(15)00613-0
49. Cramer JA, Roy A, Burrell A, et al. Medication compliance and persistence: terminology and definitions. Value Health. 2008;11(1):44-47. doi:10.1111/j.1524-4733.2007.00213.x
Motivating and Enabling Factors Supporting Targeted Improvements to Hospital-SNF Transitions
January 26th 2026Skilled nursing facilities (SNFs) with a high volume of referred patients with Alzheimer disease and related dementias may work harder to manage care transitions with less availability of resources that enable high-quality handoffs.
Read More
Specialty and Operator Status Influence Electronic Health Record Use Variation
January 22nd 2026Operators demonstrated specialty-specific differences in electronic health record efficiency, timeliness, and after-hours use, highlighting how workflow and training shape documentation behaviors across medical disciplines.
Read More

