- Center on Health Equity & Access
- Clinical
- Health Care Cost
- Health Care Delivery
- Insurance
- Policy
- Technology
- Value-Based Care
Usage of Telehealth and Retail Clinics Grew From 2017 to 2018 While That of EDs, ASCs, and Urgent Care Declined
Telehealth is expected to grow even more during the current COVID-19 pandemic. In light of the need for expanded healthcare resources, and the need to avoid in-person contact that may promote disease transmission, telehealth is widely seen as having potential to extend its reach at this time, and regulations restricting it are being relaxed.
From 2017 to 2018, telehealth use grew 12% and use of retail clinics grew 10%, but use of urgent care centers, ambulatory surgery centers (ASCs) and emergency departments (EDs) all declined, according to newly released findings from FAIR Health. Urgent care center use fell 11%, ASC use fell 12% and ED use fell 15%. These are among the findings in a new FAIR Health white paper containing the third annual edition of FH® Healthcare Indicators and FH® Medical Price Index.
Like the 2 previous editions, this year’s edition of FH Healthcare Indicators and FH Medical Price Index is intended to provide clarity to all healthcare stakeholders in a rapidly changing healthcare environment. FAIR Health, a national, independent nonprofit organization dedicated to bringing transparency to healthcare costs and health insurance information, bases the reports on its database of over 30 billion privately billed healthcare claim records—the largest such repository in the country.
Telehealth is expected to grow even more during the current COVID-19 pandemic. In light of the need for expanded healthcare resources, and the need to avoid in-person contact that may promote disease transmission, telehealth is widely seen as having potential to extend its reach at this time, and regulations restricting it are being relaxed. For more on telehealth and the pandemic, see the recent FAIR Health brief COVID-19: The Projected Economic Impact of the COVID-19 Pandemic on the US Healthcare System.
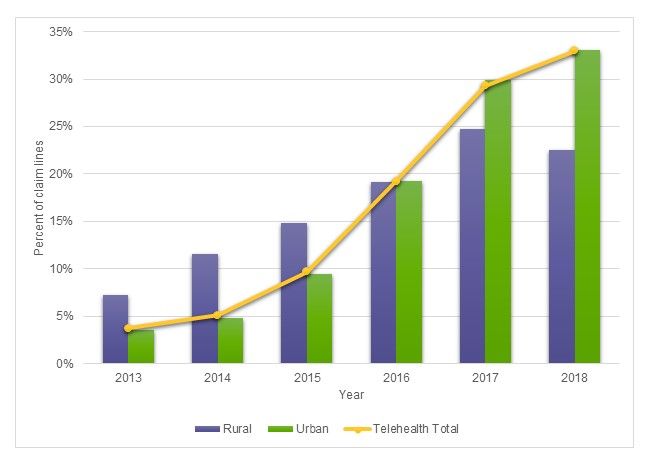
Despite the increase of telehealth and retail clinic usage from 2017 to 2018, growth in utilization of the 5 places of service as a whole slowed in recent years, according to FH Healthcare Indicators. For retail clinics and telehealth, there was growth in 2013-2018 (Figure 1), but at a slower rate compared to 2012-2017. For urgent care centers, ASCs and EDs, there was growth in 2009-2018, but at a slower rate compared to 2008-2017.
(Source: FAIR Health)

Source: FAIR Health
FH Healthcare Indicators reveal other trends and patterns in the places where patients receive healthcare. Focusing on alternative places of service—retail clinics, urgent care centers, telehealth and ASCs—as well as EDs, FH Healthcare Indicators evaluate changes in utilization, geographic and demographic factors, diagnoses, procedures and costs.
FH Medical Price Index
FH Medical Price Index reports shifts in costs and facilitates useful comparisons among medical prices in six procedure categories from May 2012 to November 2019:
- Professional evaluation and management (E/M) excluding E/Ms performed in a hospital setting);
- Hospital E/M (excluding E/Ms performed in a professional setting, such as typical office visits);
- Medicine (excluding E/Ms);
- Surgery (procedures for which the physician would bill);
- Pathology and laboratory (technical and professional components, i.e., both equipment and professional services); and
- Radiology (technical and professional components).
The reports reflect professional fees and related costs; they do not reflect facility fees.
For the period November 2018 to November 2019:
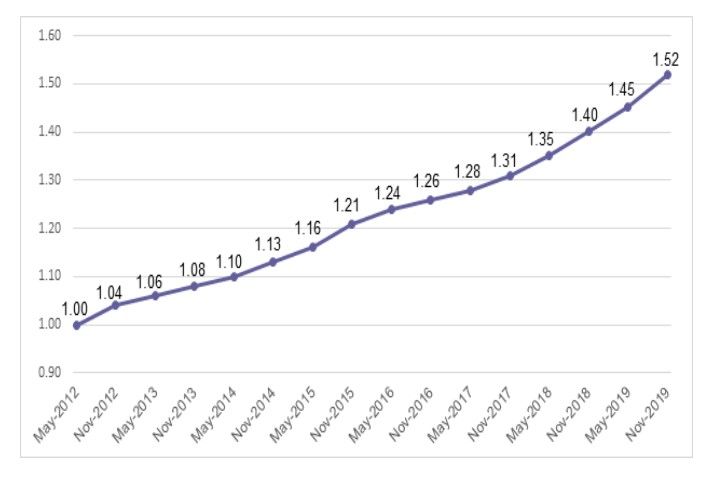
- Of the 6 procedure categories, hospital E/Ms had the greatest percent increase in charge amount index, nine percent (Figure 2), and the second greatest percent increase in allowed amount index, 7%.
- Surgery had the greatest percent increase in allowed amount index, nine percent, and the second greatest percent increase in charge amount index, seven percent.
- The radiology charge amount index decreased one percent, the only decrease in either charge amount or allowed amount indices.
Figure 2. Hospital E/M Charge Amount Index

Source: FAIR Health
Now more than ever, as the COVID-19 crisis brings healthcare to the forefront of national attention, FH Healthcare Indicators and FH Medical Price Index are relevant to understanding the nation’s healthcare system. We hope that this new edition continues to inform decision making throughout the healthcare sector by payors, providers, government officials, policy makers, academic researchers and others.”
In addition to our annual release of FH Healthcare Indicators and FH Medical Price Index, FAIR Health makes available customized indicators and indices that offer specific data subsets (e.g., based on clinical category, geographic region or time period) of particular interest to stakeholders. Custom indicators and indices can be created to clients’ specifications.
For the white paper FH® Healthcare Indicators and FH® Medical Price Index 2020: An Annual View of Place of Service Trends and Medical Pricing, click here.
For the brief COVID-19: The Projected Economic Impact of the COVID-19 Pandemic on the US Healthcare System, click here.
Note.
- An E/M is a patient-provider visit, such as for an examination, to diagnose illness or to determine or manage treatment. Professional E&Ms are typically done in a professional setting, such as a doctor’s office, while hospital E&Ms are done in a hospital setting
Robin Gelburd, JD, is the President of FAIR Health, a national, independent nonprofit organization with the mission of bringing transparency to healthcare costs and health insurance information. FAIR Health possesses the nation’s largest collection of private healthcare claims data, which includes over 30 billion claim records contributed by payors and administrators who insure or process claims for private insurance plans covering more than 150 million individuals. Certified by the Centers for Medicare & Medicaid Services (CMS) as a national Qualified Entity, FAIR Health also receives data representing the experience of all individuals enrolled in traditional Medicare Parts A, B and D; FAIR Health houses data on Medicare Advantage enrollees in its private claims data repository. Ms. Gelburd is a nationally recognized expert on healthcare policy, data and transparency.
Figure 1. Percent of Claim Lines with Telehealth Usage by Rural, Urban and National Settings, 2013-2018
