- Center on Health Equity & Access
- Clinical
- Health Care Cost
- Health Care Delivery
- Insurance
- Policy
- Technology
- Value-Based Care
Contributor: COVID-19 Pandemic’s Impact on Health Care System Documented in FAIR Health Report
A new FAIR Health white paper containing the fifth annual edition of FH Healthcare Indicators and FH Medical Price Index was released, showing a dramatic increase in telehealth utilization from 2019 to 2020.
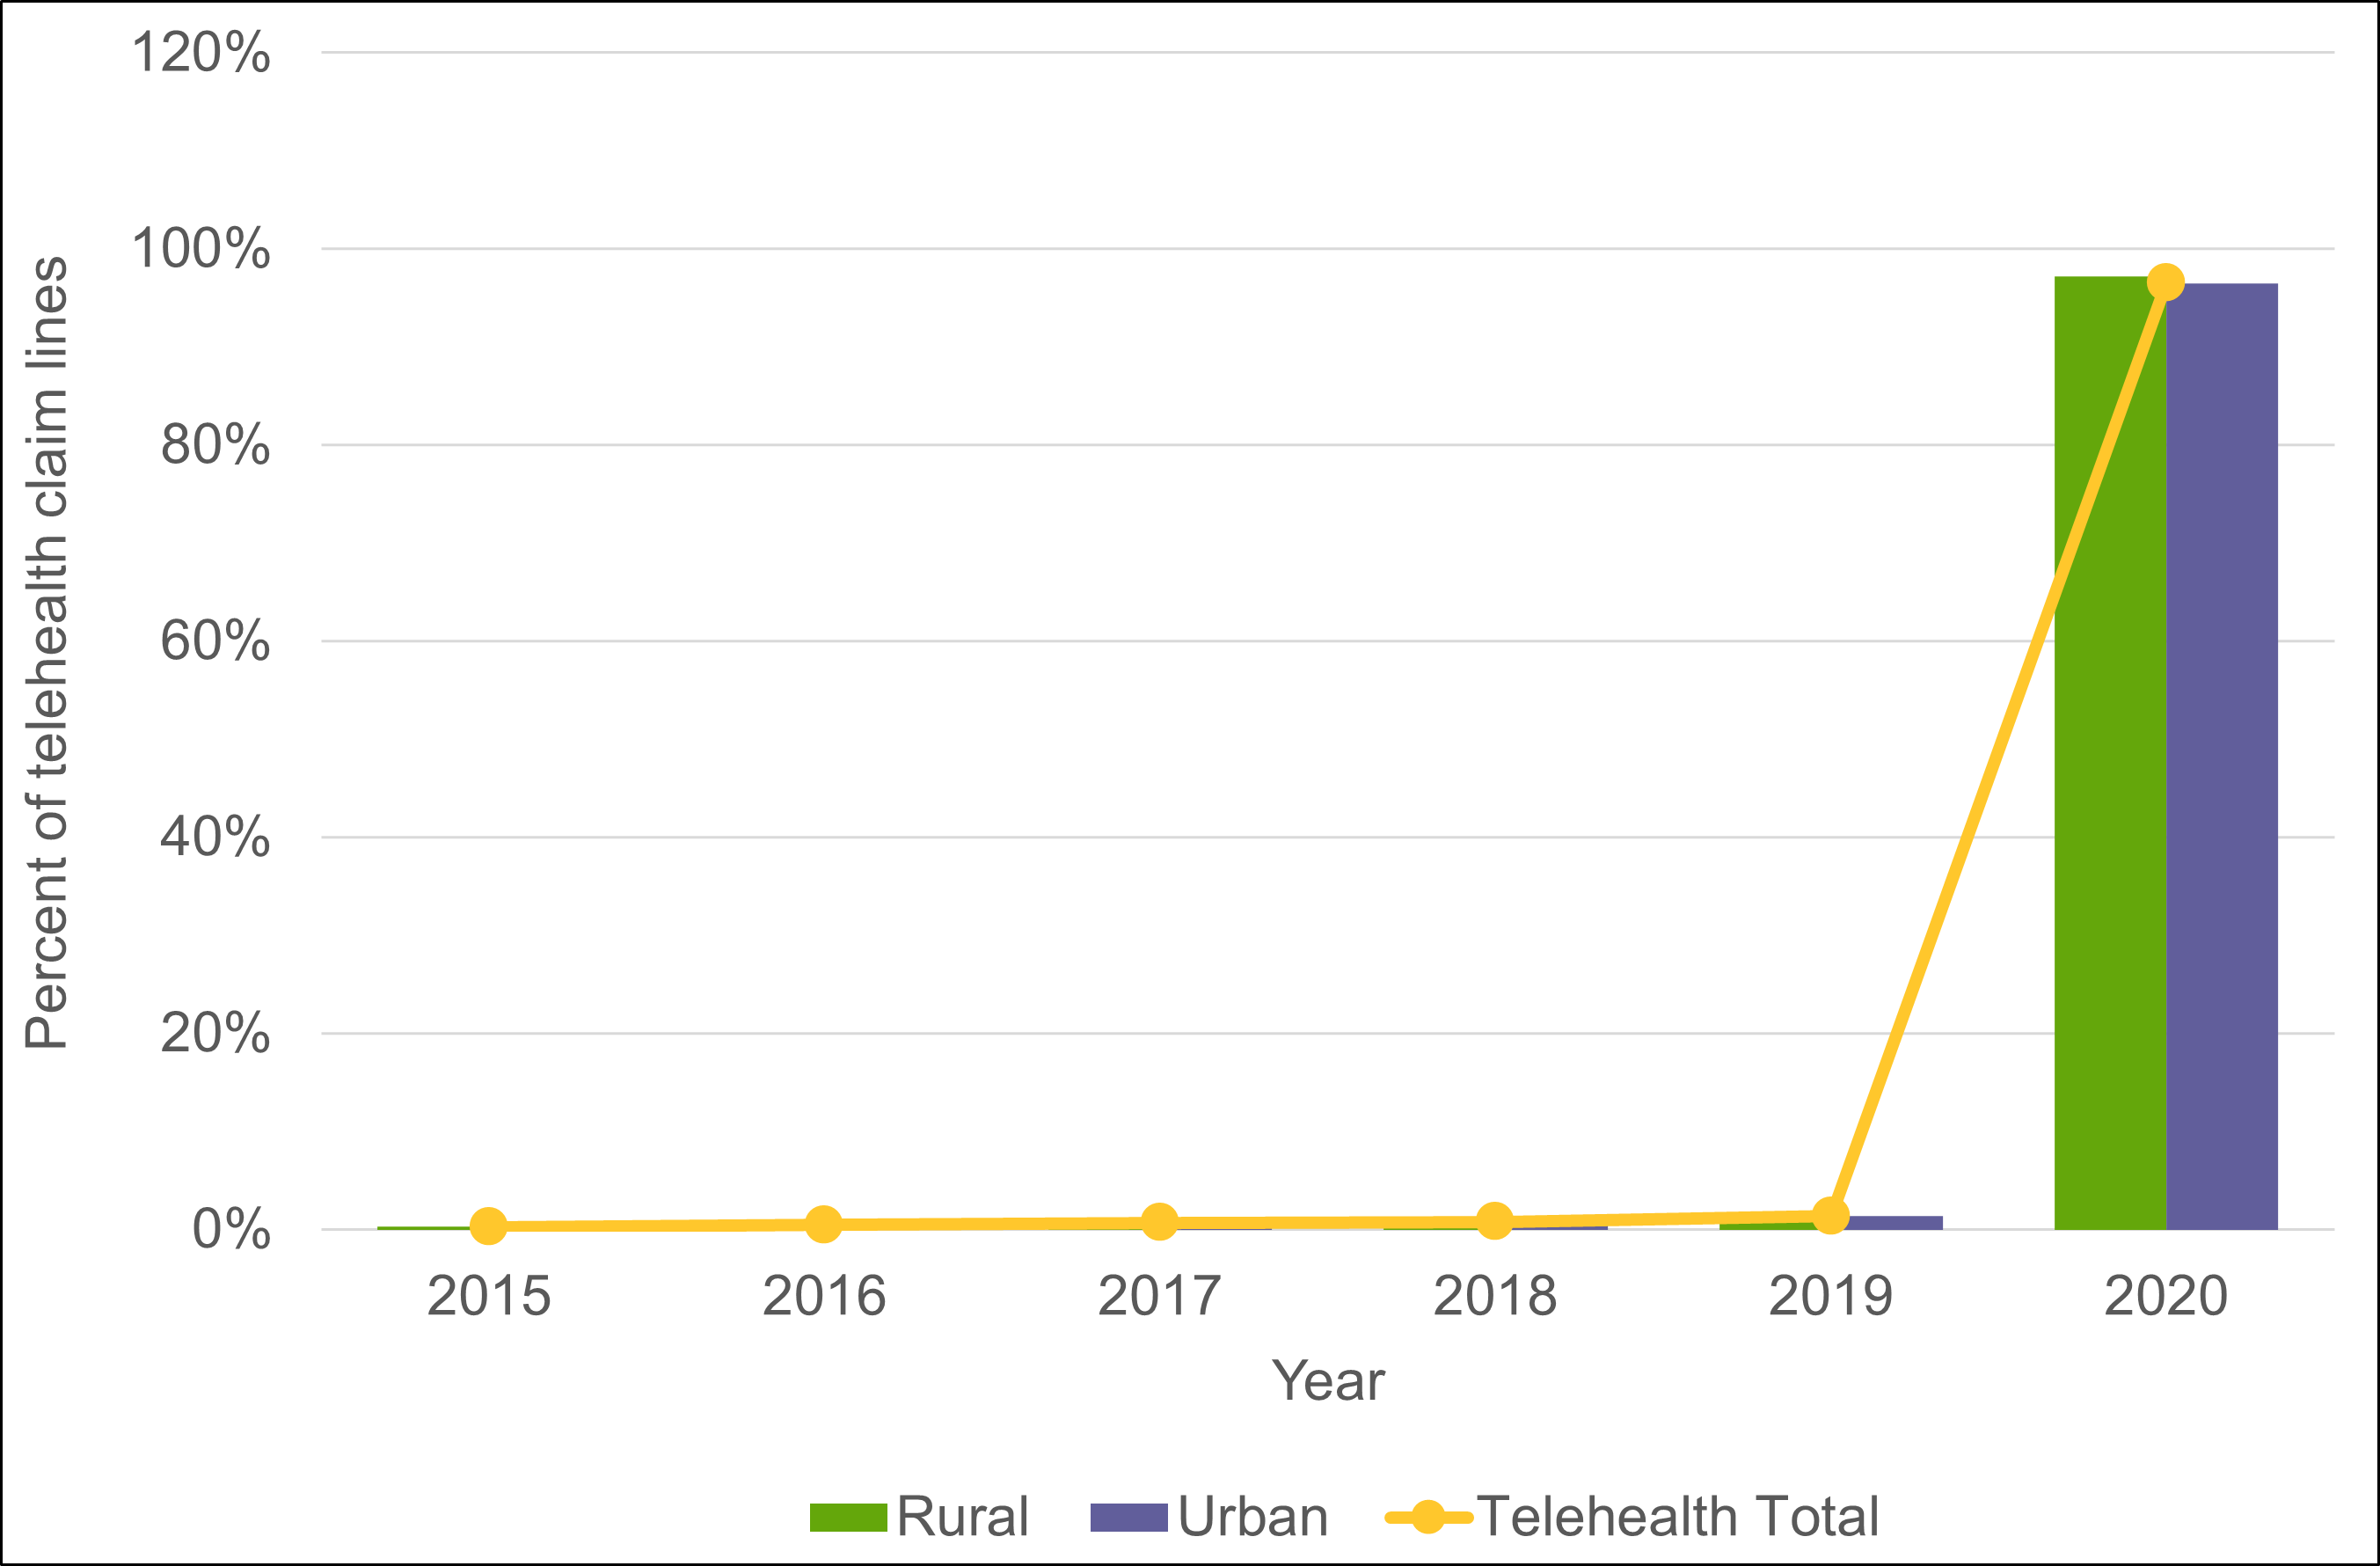
Telehealth utilization grew nationally 7060% from 2019 to 2020 (Figure 1), an increase driven by the COVID-19 pandemic and the limits imposed on certain in-office services, coupled with the greater risk of infection from in-person encounters. This is among the findings in a new FAIR Health white paper containing the fifth annual edition of FH Healthcare Indicators and FH Medical Price Index. Like the previous editions, this year’s edition of FH Healthcare Indicators and FH Medical Price Index is intended to provide clarity to all health care stakeholders in a rapidly changing healthcare environment.
Source: FAIR Health

FH Healthcare Indicators
FH Healthcare Indicators reveal trends and patterns in the places where patients receive health care. Focusing on alternative places of service—retail clinics, urgent care centers, telehealth, and ambulatory surgery centers (ASCs)—as well as emergency rooms (ERs), FH Healthcare Indicators evaluate changes in utilization, geographic and demographic factors, diagnoses, procedures, and costs.
Among the other key findings:
- Telehealth utilization increased nationally 41,919% from 2015 to 2020, a more than 40-fold increase over the growth of 1019% percent from 2014 to 2019 reported in last year’s edition.
- In all other places of service studied for changes in utilization, utilization decreased from 2019 to 2020, probably due to the impact of COVID-19. Utilization fell 38% in ASCs, 30% in ERs, 16% in urgent care centers, and 4% in retail clinics.
- In 2020 as in previous years, more claim lines were submitted for females than males in most age groups in the places of service in which FAIR Health studied gender-related patterns—retail clinics, urgent care centers, telehealth, ASCs, and ERs.
- However, in some places of service, such as retail clinics, urgent care centers, ASCs, and ERs, the gap between males and females narrowed. For example, in ERs, in the age group 61-70, the male and female shares were approximately equal (50%) in 2020, a change from 2019, when the female share had been 52% and the male share 48%. This trend bears monitoring in the future.
- In 2020, exposure to communicable diseases joined the list of the most common diagnostic categories in retail clinics, urgent care centers, and telehealth. This category largely was associated with testing and/or treatment for COVID-19 when a patient was exposed to the condition.
- Across offices, urgent care centers, and retail clinics in 2019, urgent care centers had the highest median charge amount for CPT 99203 (30-44-minute new patient office visit), but in 2020 the median charge for an office ($226) was slightly higher than that for an urgent care center ($221).
FH Medical Price Index
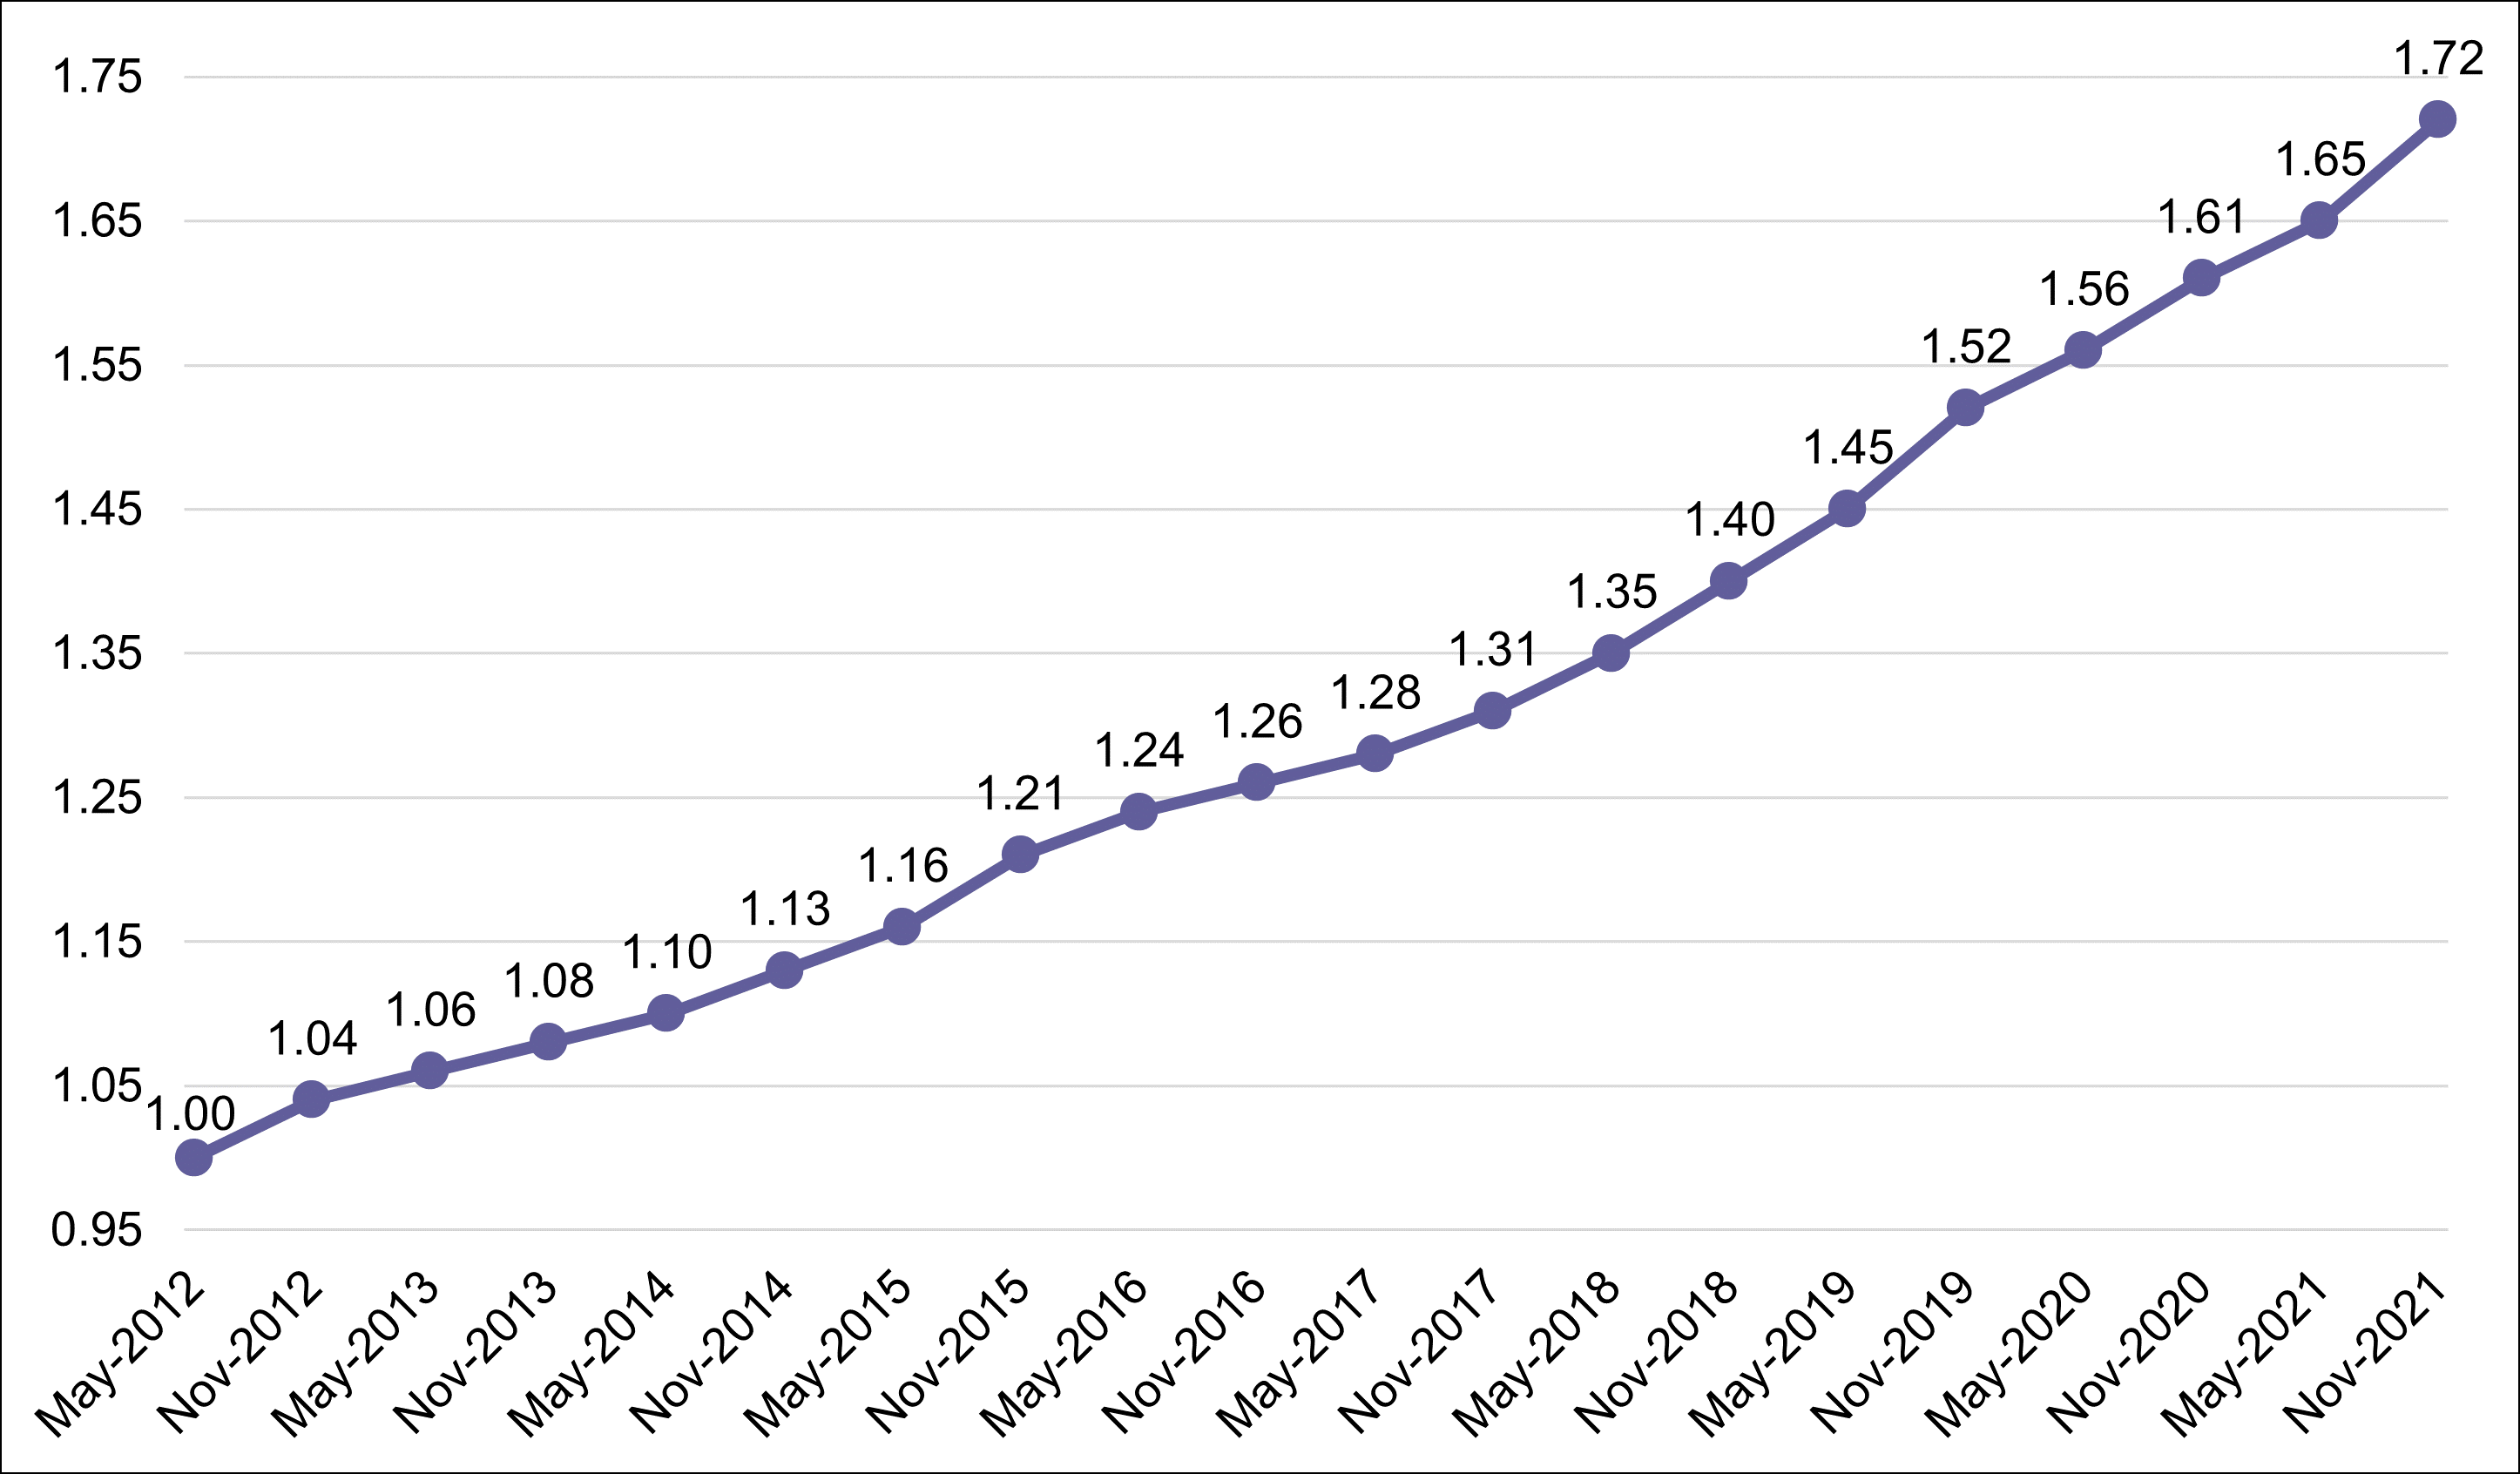
FH Medical Price Index reports shifts in costs and facilitates useful comparisons among medical prices in six procedure categories from May 2012 to November 2021:
- Professional evaluation and management (E&M; excluding E&Ms performed in a hospital setting);
- Hospital E&M (excluding E&Ms performed in a professional setting, such as typical office visits);
- Medicine (excluding E&Ms);
- Surgery (procedures for which the physician would bill);
- Pathology and laboratory (technical and professional components, e.g., both equipment and professional services); and
- Radiology (technical and professional components).
The reports reflect professional fees and related costs; they do not reflect facility fees.
For the period November 2020 to November 2021:
- Of the 6 procedure categories, hospital E&Ms had the greatest percent increase in charge amount index, 7% (Figure 2), and in allowed amount index, 5%.
- Radiology and medicine each had the smallest percent increase in charge amount index, 2%
- Radiology had the smallest percent increase in allowed amount index, 1%
Source: FAIR Health

This year’s edition of FH Healthcare Indicators and FH Medical Price Index opens a window on the impact of the COVID-19 pandemic on the nation’s healthcare system. We hope that this new edition, like those in previous years, continues to inform decision making throughout the healthcare sector by payors, providers, government officials, policy makers, academic researchers, and others.
For the new white paper, FH Healthcare Indicators and FH Medical Price Index 2022: An Annual View of Place of Service Trends and Medical Pricing, click here.
