- Center on Health Equity & Access
- Clinical
- Health Care Cost
- Health Care Delivery
- Insurance
- Policy
- Technology
- Value-Based Care
Contributor: Association Between Social Deprivation, Race/Ethnicity, and Unplanned 30-Day Hospital Readmissions for Medicare Beneficiaries
Social and economic factors impact a person's health outcomes in addition to traditional clinical factors, and there is growing recognition of the impact of social risk factors on health outcomes.1,2 National health insurers like Medicare and Medicaid, which pay for care for people who are the most at risk for experiencing health disparities, need measures of social risk to implement targeted programming and payment allocation to equitably prevent rehospitalizations. Individual social risk variables, such as those collected through social determinants of health (SDOH) surveys, have been used to predict outcomes, but there is growing scrutiny over use of individual variables by insurance carriers because collection of individual data can be deliberately skewed and may be unreliable.3,4 Community variables, however, are less gameable and do not suffer from trust barriers to collection while demonstrating compelling associations with meaningful clinical outcomes, like hospital readmission rates.5 In particular, small geographic area characteristics have been shown to predict 30-day hospital readmission rates across multiple conditions.6 A measure of neighborhood disadvantage has also been associated with all-cause 30-day hospital readmissions to a particular hospital.7 The relationship between neighborhood disadvantage and readmissions has been shown to be strongest in the top quartile of social deprivation such that an individual who is poor in a high-disadvantage neighborhood has worse outcomes than an individual who is poor in a medium- or low-disadvantage neighborhood.7 However, no one to date has shown the relationship between a small area measure of social deprivation and all-cause readmissions at a national scale. Additionally, the role of systemic racism, an important social determinant of health that is not included in social deprivation indices, in all-cause readmissions has not been adequately studied at a national scale.8,9 This analysis aimed to use a comprehensive data set of all Medicare hospital discharges across the US over a 1-year period to characterize the relationship between a small-area social deprivation measure, race/ethnicity as a proxy for systemic racism, and all-cause unplanned 30-day readmissions.
How We Designed the Analysis
This retrospective claims-based cohort analysis was designed to determine the association between social risk and 30-day hospital readmissions. To measure the independent variable—social risk—the research team used the Social Deprivation Index (SDI), which was first described in 2012 and created to identify small areas at highest risk of deprivation and poor outcomes.10 The SDI was created using factor analysis of candidate deprivation measures available in the US Census Bureau's American Community Survey (ACS). The factor analysis aimed to maximize correlation with poor access to care and poor health outcomes (diabetes, age-adjusted mortality, infant mortality, and low birth weight) at the primary care service area and Census tract levels of geography.
The index includes the following individual measures:
- Percent population less than 100% federal poverty level
- Percent population 25 years or older with less than 12 years of education
- Percent nonemployed adults under 65 years of age
- Percent population living in renter occupied housing
- Percent population living in crowded housing units
- Percent single-parent households with dependents younger than 18 years
- Percent population with no car
SDI data were obtained from the Robert Graham Center website.11
To measure the dependent variable, 30-day unplanned hospital readmissions, the research team used Medicare Part A and Part B fee-for-service (FFS) claims data. Readmissions were calculated using the standard methodology from CMS.12 Each claim was grouped into a hospital stay and linked to the beneficiary's 5-digit zip code tabulation area (ZCTA) from their mailing address. ZCTAs are created by agglomerating Census blocks into the USPS zip code that serves most of the block, rather than being strict representations of the mail delivery tracts that the USPS covers with the zip codes.13 The aggregated ZCTA level readmission rates were then linked with the corresponding SDI scores for those geographies. While it would have been preferable to use geographies smaller than ZCTA in testing these associations, we were limited by the geographies available in the Medicare claims data. The analysis included data from the continental US as well as Hawaii and Alaska but excluding the US territories.
To determine the relationship between SDI and readmissions, the unplanned readmission was treated as a negative event or risk that the beneficiary may be affected by. The formula used to calculate the risk ratio for readmission at varying levels of social deprivation was:
Readmission rate for ZCTAs with SDI ≥ X
______________________________________
Readmission rate for ZCTAs with SDI < X
with "X" varying for different values of SDI.
The risk ratios were presented as precise calculations instead of confidence intervals because the team used the entire population of Medicare claims instead of samples. Therefore, any differences in risk ratios at different SDI levels were significantly different.
In addition to using the risk ratio and to more robustly characterize the relationship between social deprivation and readmission risk, the research team used an ordinary least squares (OLS) linear regression to measure the correlation between the independent and dependent variables. The R2 statistic was used to measure the proportion of the variation in readmissions that could be predicted from SDI. The threshold for statistical significance was a P value of ≤ .05. In addition to the SDI, the regression model also included a measure of Black or Hispanic race as a proxy for systemic racism. The race variable was incorporated by including demographic data from the ACS.
In order to reduce statistical noise due to outliers, the research team adjusted the dataset to exclude clear outliers with extremely high or low population sizes and readmission rates in each ZCTA. After testing several models and reviewing the goodness of fit for each, the research team limited the data analysis to ZCTAs with population above 10th percentile and readmission rates between 5th and 95th percentile for SDI Score.
The analysis did not go through an Institutional Review Board because all of the data collection was retrospective, deidentified, and did not pose any risk to participants. CMS approved the authors to use the deidentified CMS data for this analysis. The analysis design, statistical methods, and endpoints were determined collaboratively by the investigators. Statistical analysis was performed by independent statisticians from Customer Value Partners (Fairfax, VA). All data analysis was performed using Jupyter Notebooks in Python.
What We Learned
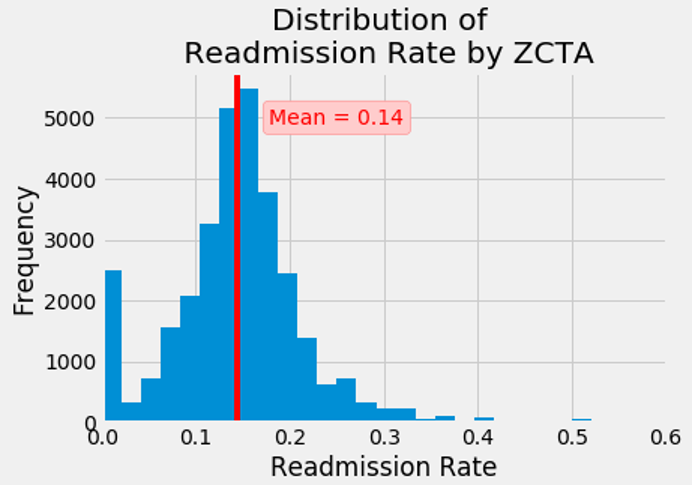
The analysis included 9.9 million hospital stays from July 1, 2018, to June 30, 2019, and spanned 32,437 ZCTAs across the US, which embodied most of the inhabited geography of the US. The mean readmission rate was 14% (SD = 0.073) (Figure 1). The high frequency of zero readmission rate was largely due to many areas with low population density with the mean of the population in that category being 95.
Figure 1: Distribution of Readmission Rate by ZCTA

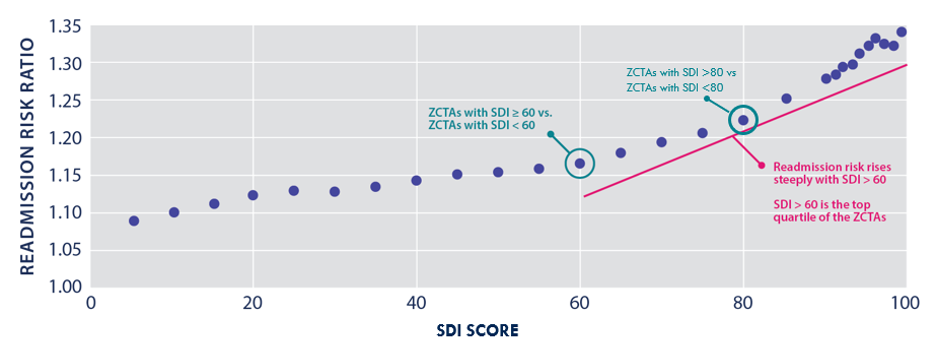
Based on risk ratios, the variables of social deprivation and hospital readmissions demonstrated a curvilinear relationship (Figure 2). Across the first 3 quartiles of SDI scores (with SDI of 60 representing the beginning of the fourth quartile of scores), the readmission risk ratio nearly linearly increased from 1.09 to 1.17. There appeared to be an inflection point after an SDI score of 60 with the risk ratio rate of change increasing between SDI scores of 60 and 80 (representing the beginning of the top decile of scores) to a readmission risk ratio of 1.23 and then reaching a maximum of 1.34 at the highest SDI scores. The 30-day unplanned hospital readmission risk is 23% to 34% higher for beneficiaries who reside in areas of social deprivation in the top decile compared with people residing in less deprived areas.
Figure 2: Risk Ratios of SDI and 30-Day Hospital Readmissions

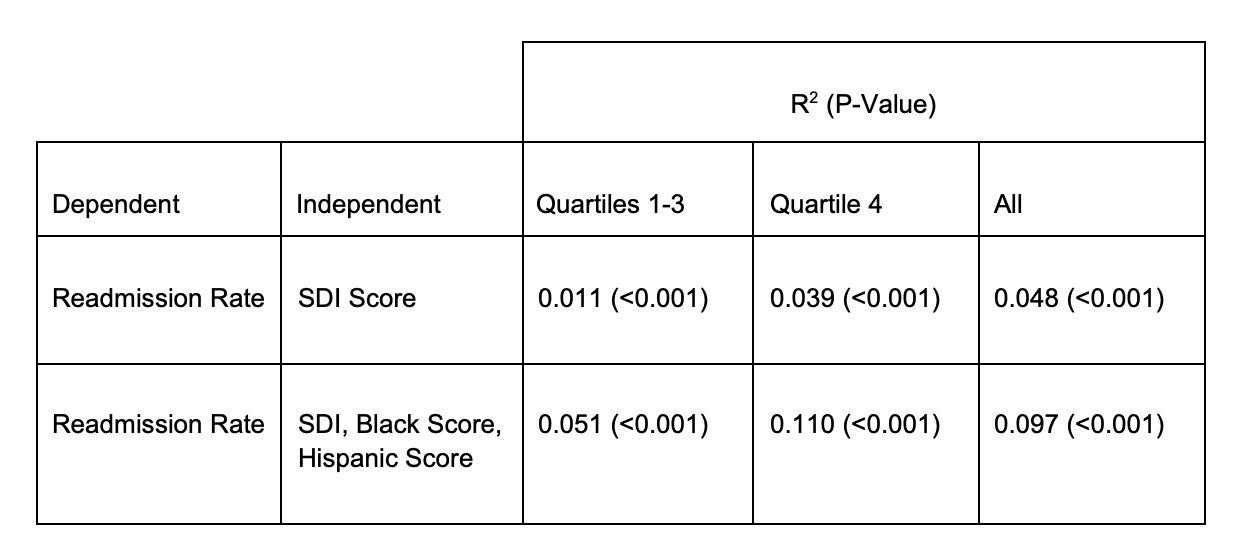
To characterize the extent of dispersion in readmission rates for each level of SDI, the research team performed an OLS regression and found an R² value of 0.011 for quartiles 1 through 3 and 0.039 (P < .001) for the fourth quartile of SDI scores for the adjusted data (Table). This means that for a person living in a relatively affluent or middle class area, 1.1% of their risk of readmission can be predicted by SDI while for a person living in an disadvantaged neighborhood, 3.9% of their risk of readmission can be predicted by SDI.
Upon addition of the race variable to the model, SDI and race combined could predict 5.1% and 11.0% of the risk of readmission for someone in a relatively affluent or middle class area and a disadvantaged area, respectively. In other words, when adding the race variable to the model, the proportion of the variation in readmissions that could be predicted increased 4.6 and 2.8 times for SDI quartiles 1 through 3 and quartile 4, respectively. Across all quartiles of SDI, adding the race variable doubled the proportion of the variation in readmission that could be predicted.
Table: OLS Regression Analysis of the Relationship Between SDI, Race, and Readmission Rate Adjusted for Population Percentile 10-100 and Readmission Rate Percentile 5-95

What Our Findings Mean for Health Care
Using a representative data set, inclusive of tens of millions of Medicare beneficiaries from across the United States, the research team demonstrated a significant relationship between higher levels of social deprivation and an undesirable outcome of interest to policy makers, unplanned 30-day hospital readmissions. Adding zip code–level race/ethnicity data to the model strongly enhanced the correlation with SDI, highlighting several potential policy implications.
Medicare currently spends an average of $35.5 billion annually on hospital readmissions, over 25% of which are avoidable.14-16 A successful intervention targeting avoidable readmission scenarios more prevalent in deprived areas need only reduce the rate of readmission by 1% to 2% to have the potential to create cost savings in the hundreds of millions of dollars. CMS is supporting 3 payment approaches that increase funding to clinics serving more deprived populations including 2 models at the Center for Medicare and Medicaid Innovation (CMMI) (ie, HEART Payments in Maryland; ACO REACH in multiple states) and 1 program at the Center for Medicare (Medicare Shared Savings Program).17-19
The analysis findings are generalizable to traditional Medicare and can likely be extrapolated to Medicare models in CMMI and possibly Medicare Advantage given the comprehensiveness of the analysis, which included all FFS Medicare claims over a 1-year period across most of the inhabited geography of the US.
This analysis reaffirmed previous findings showing that the effect of neighborhood disadvantage on readmission was lower in the first 3 quartiles of social deprivation compared to the top quartile.7 While the prior literature suggested no relationship between readmission and area deprivation for the first 85% of neighborhoods, this analysis suggests a small positive and generally linear relationship across the first 3 quartiles of SDI. Furthermore, prior research found that the neighborhoods in the top decile of disadvantage had a rehospitalization risk of 1.07 to 1.09 compared with neighborhoods in less deprived areas.6 But this analysis found a much higher risk of 1.23 to 1.34 for the top decile of SDI compared with people residing in less disadvantaged areas. Our findings build on the observations by Kind et al that there may be a certain necessary level of supportive services or characteristics in a neighborhood for patients who have been discharged from a hospital.6 But contrary to the assertion of Kind et al that a support threshold starts at the 85th percentile of the Area Deprivation Index (ADI),6 our data suggest that the threshold is present in the first 3 quartiles, albeit at a low level, and rapidly increases, rather than starts, in the fourth quartile of social deprivation.
A critical implication of the statistically significant curvilinear association between SDI and readmission rate throughout all quartiles is that policy makers no longer have to rely on overly broad thresholds to adjust payments at quintile or decile levels like the Maryland HEART or ACO REACH programs, respectively. This finding suggests that policy and payment design can include more granular payment adjustments at each level of SDI to account for nuanced differences between neighborhoods.
Another important policy implication is that payment adjustments should always be upward at all levels of SDI given that there is increased risk for readmission at all levels of SDI and that even at lower SDI quartiles, there is a significant proportion of variability in readmissions attributable to SDI. This recommendation suggests that demonstrations like the ACO REACH model should be modified to avoid the downward adjustment of –$6 per member per month (PMPM) for the bottom 5 deciles of area deprivation.
While the association between SDI and readmission risk is statistically significant, the R2 values are relatively low, especially in lower quartiles of SDI. This suggests that readmissions are only mildly to moderately predicted by SDI and that variability in individual-level clinical or social factors and/or variation in quality of care may play an important role in predicting readmissions, especially at lower levels of SDI. This finding supports a recommendation from a recent set of policy design workshops conducted by the American Board of Family Medicine Foundation and Social Innovation Ventures, which concluded that social risk factors should be incorporated into risk-adjusted payments using both individual variables, such as SDOH surveys, and community variables, such as the SDI.5
Although SDI alone only mildly to moderately predicts readmission risk, the addition of the race variable meaningfully increased the ability to predict readmission risk. The research team believes that the race variable most likely approximates population-level systemic racism rather than individual-level biological or cultural differences. In other words, a person living in an affluent or middle class area is less likely to be readmitted to the hospital than the same person living in a disadvantaged neighborhood. But if that person is Black or Hispanic, their risk of bouncing back to the hospital quadruples in an affluent or middle class neighborhood and almost triples in a poor neighborhood compared with non-Black or non-Hispanic individuals.
This analysis had several limitations. Medicare data privacy restrictions only permitted a match of Medicare beneficiary addresses to 5-digit zip and ZCTA, leaving opportunity for future research to improve precision and reliability through matching to smaller geographies such as Census tract or block group. Census efforts to expand research data centers inclusive of health care data may eventually even permit individual address linkages in secure environments.
Another limitation of the findings of this research is that they may not be generalizable to areas with the lowest decile of population density, which would include extremely rural and frontier communities. While the adjusted data represent the vast majority of Americans, these data exclude areas of extremely high and low readmission rates. Further research should explore how to incorporate these areas to derive lessons from positive and negative deviants through alternative, more sophisticated ways of grouping beneficiaries like Census tracts.
Additionally, it is unclear if the differences in the findings of this analysis and that of Kind et al are attributable to the larger and more complete sampling frame of this analysis and/or due to differences between the ADI and the SDI. More research is needed to compare the ADI and SDI.
Finally, we did not control for certain factors that could be confounding variables such as clinical complexity or dual eligibility for Medicare and Medicaid. The next phase of this research could explore more controlled studies.
Key Takeaways for Managed Care
Higher scores on an easily replicated and regularly updated Social Deprivation Index, built from Census variables publicly available at small geographies, were significantly associated with greater risk of expensive and avoidable hospital readmissions in Medicare beneficiaries. Meaningful geographic variation in small area deprivation scores suggests that there is an opportunity for resource allocation strategies to mitigate readmissions and close health equity gaps.
Policy makers should invest in payment and delivery models that are deliberately aimed at not only addressing signs of deprivation such as low education, unemployment, housing insecurity, and transportation insecurity, but also addressing more upstream health determinants like systemic racism.
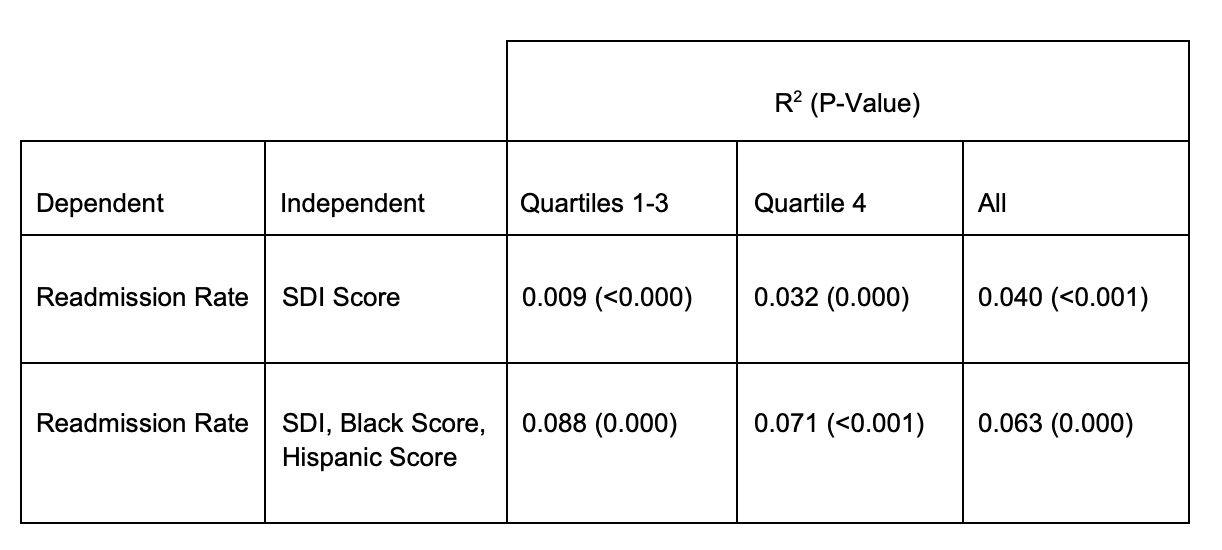
eAppendix Table: Unadjusted OLS Regression Analysis of the Relationship Between SDI, Race, and Readmission Rate

References
- Schroeder SA. We can do better—improving the health of the American people. N Engl J Med. 2007;357(12):1221-1228. doi:10.1056/NEJMsa073350
- Alley DE, Asomugha CN, Conway PH, Sanghavi DM. Accountable Health Communities—addressing social needs through Medicare and Medicaid. N Engl J Med. 2016;374(1):8-11. doi: 10.1056/NEJMp1512532
- Gilfillan R, Berwick DM. Medicare Advantage, direct contracting, and the Medicare ‘money machine,’ part 1: the risk-score game. Health Affairs Forefront. September 9, 2021. doi:10.1377/hblog20210927.6239
- Phillips RL, Ostrovsky A, Bazemore AW. Adjusting Medicare payments for social risk to better support social needs. Health Affairs Forefront. June 1, 2021. doi:10.1377/hblog20210526.933567
- Developing Medicare/Medicaid policy options for social risk payment adjustment. The Center for Professionalism and Value in Health Care. Accessed January 20, 2023. https://professionalismandvalue.org/event/developing-medicare-medicaid-policy-options-for-social-risk-payment-adjustment-workshop-series/
- Kind AJH, Jencks S, Brock J, et al. Neighborhood socioeconomic disadvantage and 30-day rehospitalization: a retrospective cohort study. Ann Intern Med. 2014;161(11):765-774. doi:10.7326/M13-2946
- Hu J, Kind AJH, Nerenz D. Area deprivation index predicts readmission risk at an urban teaching hospital. Am J Med Qual. 2018;33(5):493-501. doi:10.1177/1062860617753063
- Rodriguez-Gutierrez R, Herrin J, Lipska KJ, Montori VM, Shah ND, McCoy RG. Racial and ethnic differences in 30-day hospital readmissions among US adults with diabetes. JAMA Netw Open. 2019;2(10):e1913249. doi:10.1001/jamanetworkopen.2019.13249
- Basu J, Hanchate A, Bierman A. Racial/ethnic disparities in readmissions in US hospitals: the role of insurance coverage. Inquiry. 2018;55:46958018774180. doi:10.1177/0046958018774180
- Butler DC, Petterson S, Phillips RL, Bazemore AW. Measures of social deprivation that predict health care access and need within a rational area of primary care service delivery. Health Serv Res. 2013;48(2, pt 1):539-559. doi:10.1111/j.1475-6773.2012.01449.x
- Social Deprivation Index (SDI). Robert Graham Center. Accessed January 20, 2023. https://www.graham-center.org/maps-data-tools/social-deprivation-index.html
- Readmission measures methodology. CMS. Accessed January 20, 2023. https://qualitynet.cms.gov/inpatient/measures/readmission/methodology
- ZIP code tabulation areas (ZCTAs). US Census Bureau. Accessed January 20, 2023. https://www.census.gov/programs-surveys/geography/guidance/geo-areas/zctas.html
- Weiss AJ, Jiang HJ. Overview of clinical conditions with frequent and costly hospital readmissions by payer, 2018. Healthcare Cost and Utilization Project statistical brief 278. July 2021. Accessed January 20, 2023. https://www.hcup-us.ahrq.gov/reports/statbriefs/sb278-Conditions-Frequent-Readmissions-By-Payer-2018.pdf
- Auerbach AD, Kripalani S, Vasilevskis EE, et al. Preventability and causes of readmissions in a national cohort of general medicine patients. JAMA Intern Med. 2016;176(4):484–493. doi:10.1001/jamainternmed.2015.7863
- Positive outcomes for high-need, high-cost beneficiaries in Medicare Advantage compared to traditional fee-for-service Medicare. Center for Innovation in Medicare Advantage. December 2020. Accessed January 20, 2023. https://bettermedicarealliance.org/wp-content/uploads/2020/12/BMA-High-Need-Report.pdf
- Maryland Primary Care Program. HEART Payment Playbook. Maryland Department of Health. Accessed January 20, 2023. https://health.maryland.gov/mdpcp/Documents/MDPCP_HEART_Payment_Playbook.pdf
- ACO REACH. CMS. Accessed January 20, 2023. https://innovation.cms.gov/innovation-models/aco-reach
- Calendar year (CY) 2023 Medicare Physician Fee Schedule Final Rule - Medicare Shared Savings Program. CMS. Accessed January 20, 2023. https://edit.cms.gov/files/document/mssp-fact-sheet-cy-2023-pfs-final-rule.pdf
2 Commerce Drive
Cranbury, NJ 08512
AJMC®
All rights reserved.