- Center on Health Equity & Access
- Clinical
- Health Care Cost
- Health Care Delivery
- Insurance
- Policy
- Technology
- Value-Based Care
Association of the MedWise Risk Score With Health Care Outcomes
Objectives: Older patients are especially vulnerable to drug-related problems due to multiple prescription drugs, which increases their risk of drug-drug interactions and adverse drug events (ADEs). This study aimed to examine outcomes associated with the MedWise Risk Score (MRS) in a Medicare Part D population, including total medical expenditures, ADEs, falls, mortality, emergency department (ED) visits, hospital admissions, and length of stay (LOS).
Study Design: Retrospective observational study.
Methods: The association between MRS and patient health outcomes was derived using drug claims data from 213,561 beneficiaries and medication risk stratification using outcomes data in 2018 with 1 year of follow-up. Analyses were conducted with the Max MRS and the Mean MRS calculated over the year. Analyses utilizing the Max MRS performed better, and results using the Max MRS are presented. Statistical analyses were performed using linear regression, logistic regression, negative binomial regression, and zero-inflated Poisson (ZIP) models.
Results: Of 203,630 patients studied (mean ± SD age, 76.0 ± 8.0 years), 4.9%, 9.8%, 24.5%, and 15.5% experienced at least 1 ADE, fall, ED visit, and hospital admission, respectively, in 2018. The MRS was associated with an 8.5% change in total medical expenditure per 1-unit increase. The adjusted odds ratio (OR) of ADE was 1.058 (95% CI, 1.055-1.06)/unit MRS. ADEs, falls, and death were more likely in elevated MRS categories (eg, OR of 4.45 for ADEs [95% CI, 4.10-4.83], 5.51 for falls [95% CI, 5.17-5.87], and 4.42 for death [95% CI, 3.82-5.12], respectively forSevere MRS group). Our model predicts 7000 ED visits for every 100,000 patients per unit increase of the MRS. The ZIP models estimated ORs of 1.03 and 1.01 for hospital admissions and increase in hospital LOS, respectively, per MRS unit.
Conclusions: This study shows that MRS was associated with health outcomes and therefore could be used to identify patients at increased risk of negative outcomes based primarily on their medication regimens.
Am J Manag Care. 2021;27(suppl 16):S280-S291. https://doi.org/10.37765/ajmc.2021.88753
For author information and disclosures, see end of text.
Introduction
Adverse drug events (ADEs)—unintended injuries resulting from a medical intervention related to a drug—are the fourth leading cause of death in the United States.1-4 ADEs account for one-third of hospital adverse events, can prolong hospital length of stay (LOS) by 1.7 to 4.6 days, and affect 2 million persons annually.3 ADEs can also occur in an outpatient setting.3,5 Outpatient ADEs annually lead to more than 3.5 million physician office visits, 1 million emergency department (ED) visits, and 125,000 additional hospital admissions.3 The population aged 65 years or older experiences the highest hospitalization rate from ADEs, at 43.6%.3,5 Older adults are significantly more likely than younger adults to be hospitalized for ADEs from associated falls, hypotension, dizziness, and delirium that can occur as adverse effects of such medications as blood thinners, opioids, and drugs prescribed to manage diabetes or seizures.6,7 Unfortunately, life expectancy in some patient groups can also be reduced by ADEs.8
In 2016, the US annual cost of nonoptimized prescription drug–related morbidity and mortality was estimated at $528.4 billion (range, $495.3 billion-$672.7 billion), equivalent to 16% of total US health care expenditures.9 Further, the average cost of a patient experiencing a treatment failure, a new medical problem, or both after initial prescription use was $2481 per event (range, $2233-$2742).9 In fact, study results have shown that the United States spends more money to correct problems related to medication than on the medications themselves.2
An important medication-related problem to consider is polypharmacy, which is generally defined either as the concurrent use of 5 or more medications or as the use of more drugs than clinically necessary.10 Polypharmacy is often the result of a prescribing cascade, in an attempt to meet disease-specific guideline goals or to treat comorbidities or multimorbidities.11 Polypharmacy can lead to drug-drug interactions (DDIs), as a patient’s risk for DDIs increases with each comorbidity and each drug prescribed.12,13 Among older adults, the prevalence of polypharmacy has steadily increased, as the number of prescribed medications tends to increase concomitantly with age and comorbidities.2
Tabula Rasa HealthCare’s MedWise Risk Score (MRS) is a proprietary and patented risk score composed of aggregated values for pharmacokinetic and pharmacodynamic factors that are known to be associated with medication-related morbidity and mortality.14-17 Evaluating a patient’s MRS can assist in reducing the risk of falls, medication-related errors, hospitalizations, and readmissions. Bankes et al, for instance, found that an elevated MRS results in a higher prevalence of ADEs and falls, in addition to increased ED visits and hospital admissions.14 Further, Ratigan et al found that increased mortality was associated with an elevated MRS.17
This retrospective study aims to investigate outcomes associated with a patient’s elevated MRS, including total annual medical costs; number of ED admissions; number of hospitalizations; average LOS per hospitalization; number of ADEs, if any; number of falls, if any; and death. The research presented here was conducted by Tabula Rasa HealthCare, with the oversight of ClearStone Solutions, the contracted Part D administrator for plan participant Blue Cross and Blue Shield Northern Plains Alliance (BCBS-NPA), without input from CMS.
Methods
We performed retrospective observational cohort analyses of health care claims data for more than 213,561 beneficiaries living in Part D Region 25 (Iowa, Minnesota, Montana, Nebraska, North Dakota, South Dakota, and Wyoming) whose coverage was provided by BCBS-NPA. NPA standard members must qualify for Medicare but may use additional types of insurance outside NPA. Data were obtained through NPA’s Medicare Part D administrator, ClearStone Solutions, which approved this project. This study received a waiver of informed consent from the Biomedical Research Alliance of New York Institutional Review Board (protocol number 19-12-172-427) and was conducted in accordance with ethical principles set forth by the Declaration of Helsinki. Patients were excluded if they were not enrolled in the health plan for the entire year of 2018, if no drug claims data were available, or if sex determination was missing. Patients who died during the studied year period of 2018 were included only in the death analysis. Funding was obtained by BCBS NPA in Medicare Part D Region 25, the model participant, under the 5-year CMS Innovation Center’s Enhanced MTM model. Through NPA’s Part D plan administrator, ClearStone Solutions, funds were provided to Tabula Rasa HealthCare, Inc, for delivery of Enhanced MTM services and research. In this study, data were analyzed regardless of patient’s enrollment in the Enhanced MTM program.
Data
The following data were collected and analyzed: age; gender; health claims, classified by International Classification of Diseases, Tenth Revision (ICD-10) codes; Medicare Part D drug claims data categorized via National Drug Codes (NDCs); and Medicare Part A (hospitalizations) and Part B (outpatient) claims. Patient race or ethnicity data were not provided in the context of this study. We excluded 11,518 patients who were not prescribed any medications from January 1, 2018, to December 31, 2018. Drug claims data from October 1, 2017, to December 31, 2018, were utilized to derive the MRS: A 3-month lead (October 1, 2017, to December 31, 2017) was accepted to cover the gap in drug claims in the first quarter of 2018. Comorbidities were assessed using the ICD-10 codes; prescription medications were identified from the pharmacy claims database and were extracted using NDCs. The presence of comorbidities was confirmed by the presence of at least 1 diagnostic code identified during the studied period. Charlson Comorbidity Index (CCI) scores were calculated.18,19 Median annual total medical expenditures (Medicare Parts A and B) were used for the cost analysis. The covariates considered were patient age (at the end of the year), sex, CCI score, and MRS. Deaths recorded from January 2018 to April 2019 were used, and the corresponding MRS of each patient who died during 2018 was calculated (delay in death registry in the first quarter of 2019). For deceased patients, date of death was provided as part of the monthly claims data and reported as all-cause mortality.
MedWise Risk Score (MRS)
A risk stratification was performed to derive the MRS using algorithms that consider 5 medication characteristics to compute risk of ADEs as described previously.15-17,20 Briefly, it includes (1) computation of a drug regimen relative odds ratio (OR) for ADEs using the US FDA pharmacovigilance database, (2) anticholinergic cognitive burden, (3) sedative burden, (4) drug-induced long QT syndrome burden, and (5) cytochrome P450 drug interaction burden risk scores.16,17,20 There are 5 MRS categories: Minimal (0-9), Low (10-14), Intermediate (15-19), High (20-29), and Severe (≥ 30). For all drug regimens, MRSs were generated by processing prescribed drug claims using NDCs as drug identifiers. Medication data were extracted; errors and inconsistencies were cleaned through quality and integrity analyses. Since NDCs can also be assigned to products that are not medications (eg, medical devices and consumables), active medication data were further filtered to exclude such NDCs.
Two measures of the MRS, each for a patient over the year, were considered: the maximum MRS (Max MRS) and the time-weighted Mean MRS. To calculate Mean MRS and Max MRS, the data about a prescription’s fill dates and its days’ supply were used. These data were obtained from insurance claims from January 1, 2018, until December 31, 2018. Distinct drug addition and drug removal events were identified from prescription fill dates and days’ supply information. Using these events, timelines of 2018 were divided into smaller intervals between addition or removal events of each year. Each of these intervals has a single drug regimen prescribed through this interval. For all patients continuously enrolled in 2017 and 2018, their medications prescribed in 2017 over the period ending in 2018 were considered in corresponding time intervals for the later year (up to 90 days pre-2018 period). For each patient, MRS values were generated for each distinct drug regimen event. Max MRS per patient was defined as the maximum value of MRS among all drug regimens derived for this patient. The Mean MRS was calculated as an average MRS weighted by the time intervals.
Outcomes
This study examined the association between patient MRS (Max MRS and Mean MRS) and 7 observable outcomes: medical expenditure (Medicare Parts A and B), ADEs, falls, all-cause mortality, hospital admissions, ED visits, and hospital LOS.
Statistical Analyses
This study assessed the association between MRS and patient cost using linear regression. Since patient cost has a highly skewed distribution, we regressed against log10 (patient cost +1). The overdispersion of $0 cost count data was considered in the analysis: Regression was conducted with patients having cost greater than $0, and then the output of the model was multiplied at each MRS value by the fraction of patients at that MRS who had $0 cost. MRS (Max or Mean), age, and sex were used as covariates. CCI score was not used as a covariate for the cost analysis since it is calculated based on claims and might cause data leakage.
This study used logistic regression to analyze 3 binary outcomes: whether a patient had an ADE, whether the patient had a fall, and whether a patient died. Regression coefficients were utilized to determine the OR of the outcome associated with an increase in MRS unit or risk categories. The model output was used to determine estimated probabilities of the event occurring to evaluate model performance. To control for covariates, 6 models were trained for each outcome and MRS type (Max MRS, Max MRS risk categories, Mean MRS, and Mean MRS risk categories): model 1, MRS; model 2, MRS and age; model 3, MRS and sex; model 4, MRS and CCI score; model 5, MRS, age, and sex; and model 6, MRS, age, sex, and CCI score. Model performance was evaluated using the area under the receiver operator characteristics (ROC) curve (AUC) and the sensitivity and specificity at the Youden threshold.
Negative binomial regression was used to model the number of times a patient went to the ED. The number of observations (ED visits) was used in the regression model with a log-link function, and incident rate ratios (IRRs) were determined from the resulting coefficients. For hospital admissions and LOS, since many patients were not admitted to the hospital, a zero-inflated Poisson regression model was utilized.
Statistical analysis was done in SAS statistical software, version 9.4 (SAS Institute Inc) and in Python 3.8.10 using the NumPy (v. 1.20.2), pandas (v. 1.2.4), statsmodels (v. 0.12.2), scikit-learn (v. 0.24.2), Matplotlib (v. 3.3.4), and seaborn (v. 0.11.1) packages. Some data extraction and cleaning was performed in Microsoft SQL Server (v. 18) and in R, (v. 1.2.5019) with the dplyr, data.table, and sqldf packages. Webservice interface and customized scripts in Microsoft SQL Server (v. 18) were used to perform medication risk stratification and to manipulate large datasets.
Results
This retrospective study examined the MRS based on drug claims and outcomes data for 203,691 BCBS NPA beneficiaries in 2018 (plus 2813 deceased patients who were included only in the death association analysis). Table 1 includes demographic and descriptive data for the studied population. Participants included in the analyses were 59.1% female (n = 120,333) with an average age of 76.0 ± 8.0 years; they received, on average, 4.6 ± 3.3 medications per day, and the mean CCI score for this population was approximately 1.2.
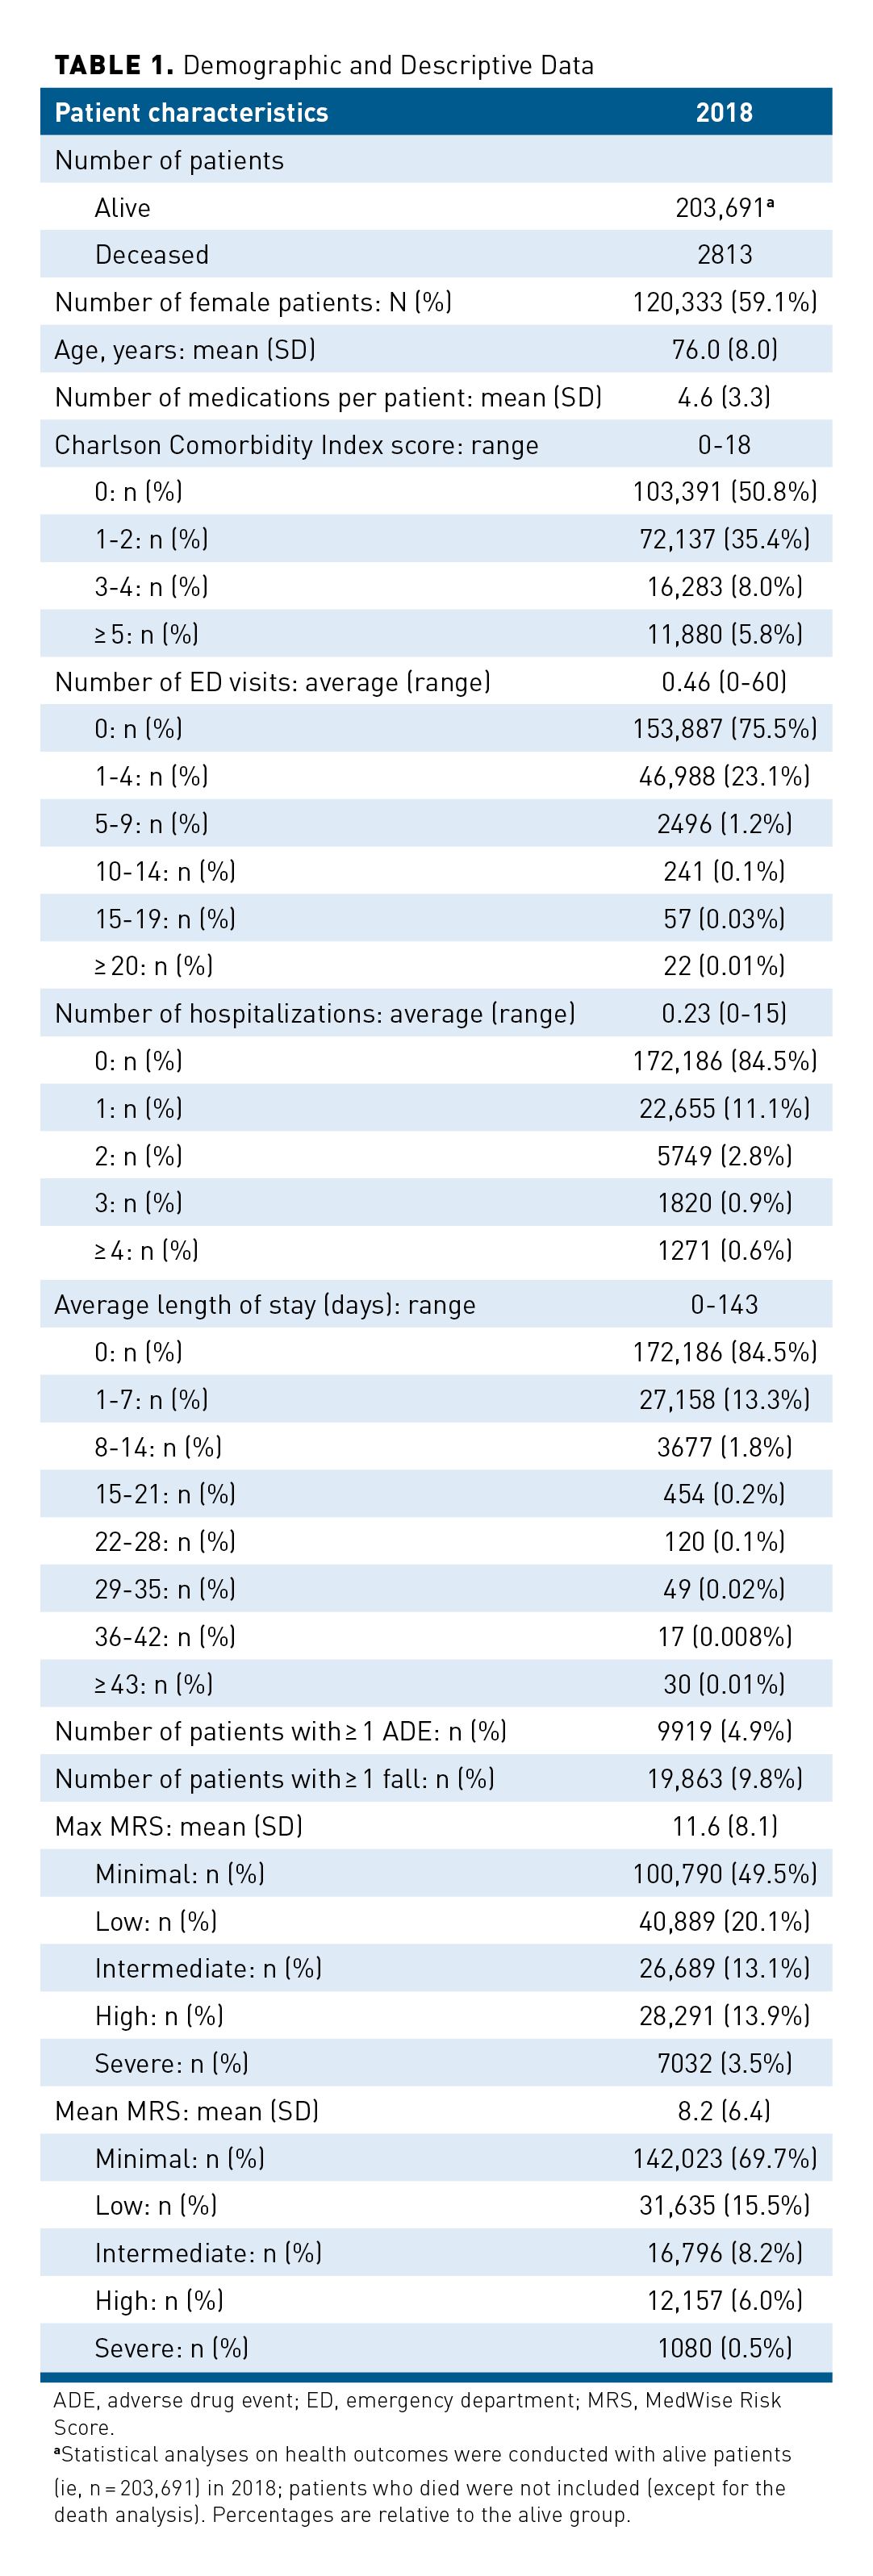
The average Max MRS for this population was 11.6 ± 8.1 with an average Mean MRS of 8.2 ± 6.4. Each patient was assigned a categorical Max MRS of Minimal (n = 100,790; 49.5%), Low (n = 40,889; 20.1%), Intermediate (n = 26,689; 13.1%), High (n = 28,291; 13.9%), or Severe (n = 7032; 3.5%; Table 1). Analyses were conducted with both the Max MRS and the Mean MRS. However, analyses utilizing the Max MRS performed better; therefore, subsequent result sections report analyses using the Max MRS. Mean MRS results are provided in eAppendix Figures 1, 2, and 3 and eAppendix Table 1 (eAppendices available here). Results derived from the performance analyses with Max MRS and Mean MRS are provided in eAppendix Tables 2, 3, and 4.
MRS and Medical Expenditures
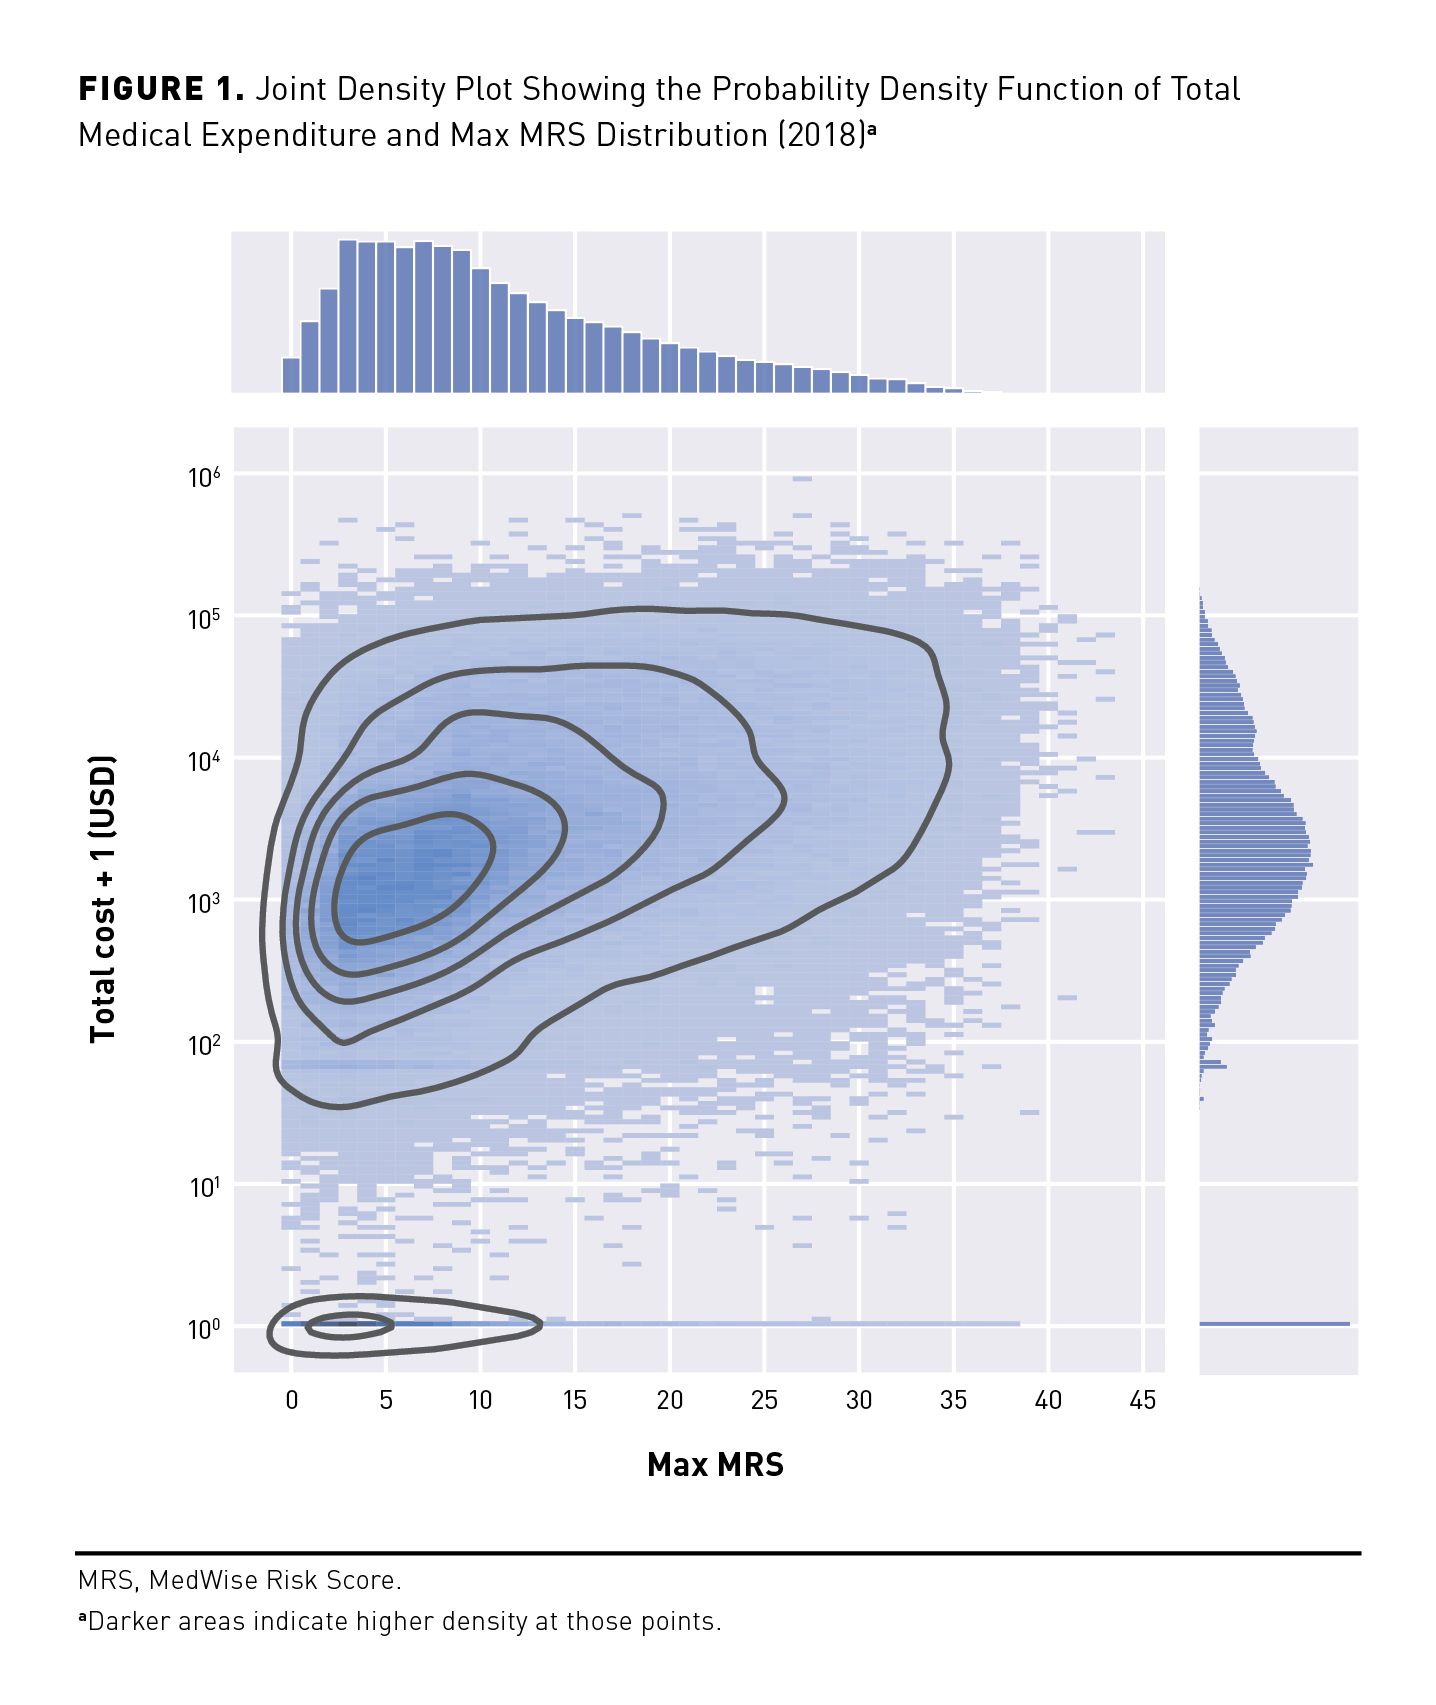
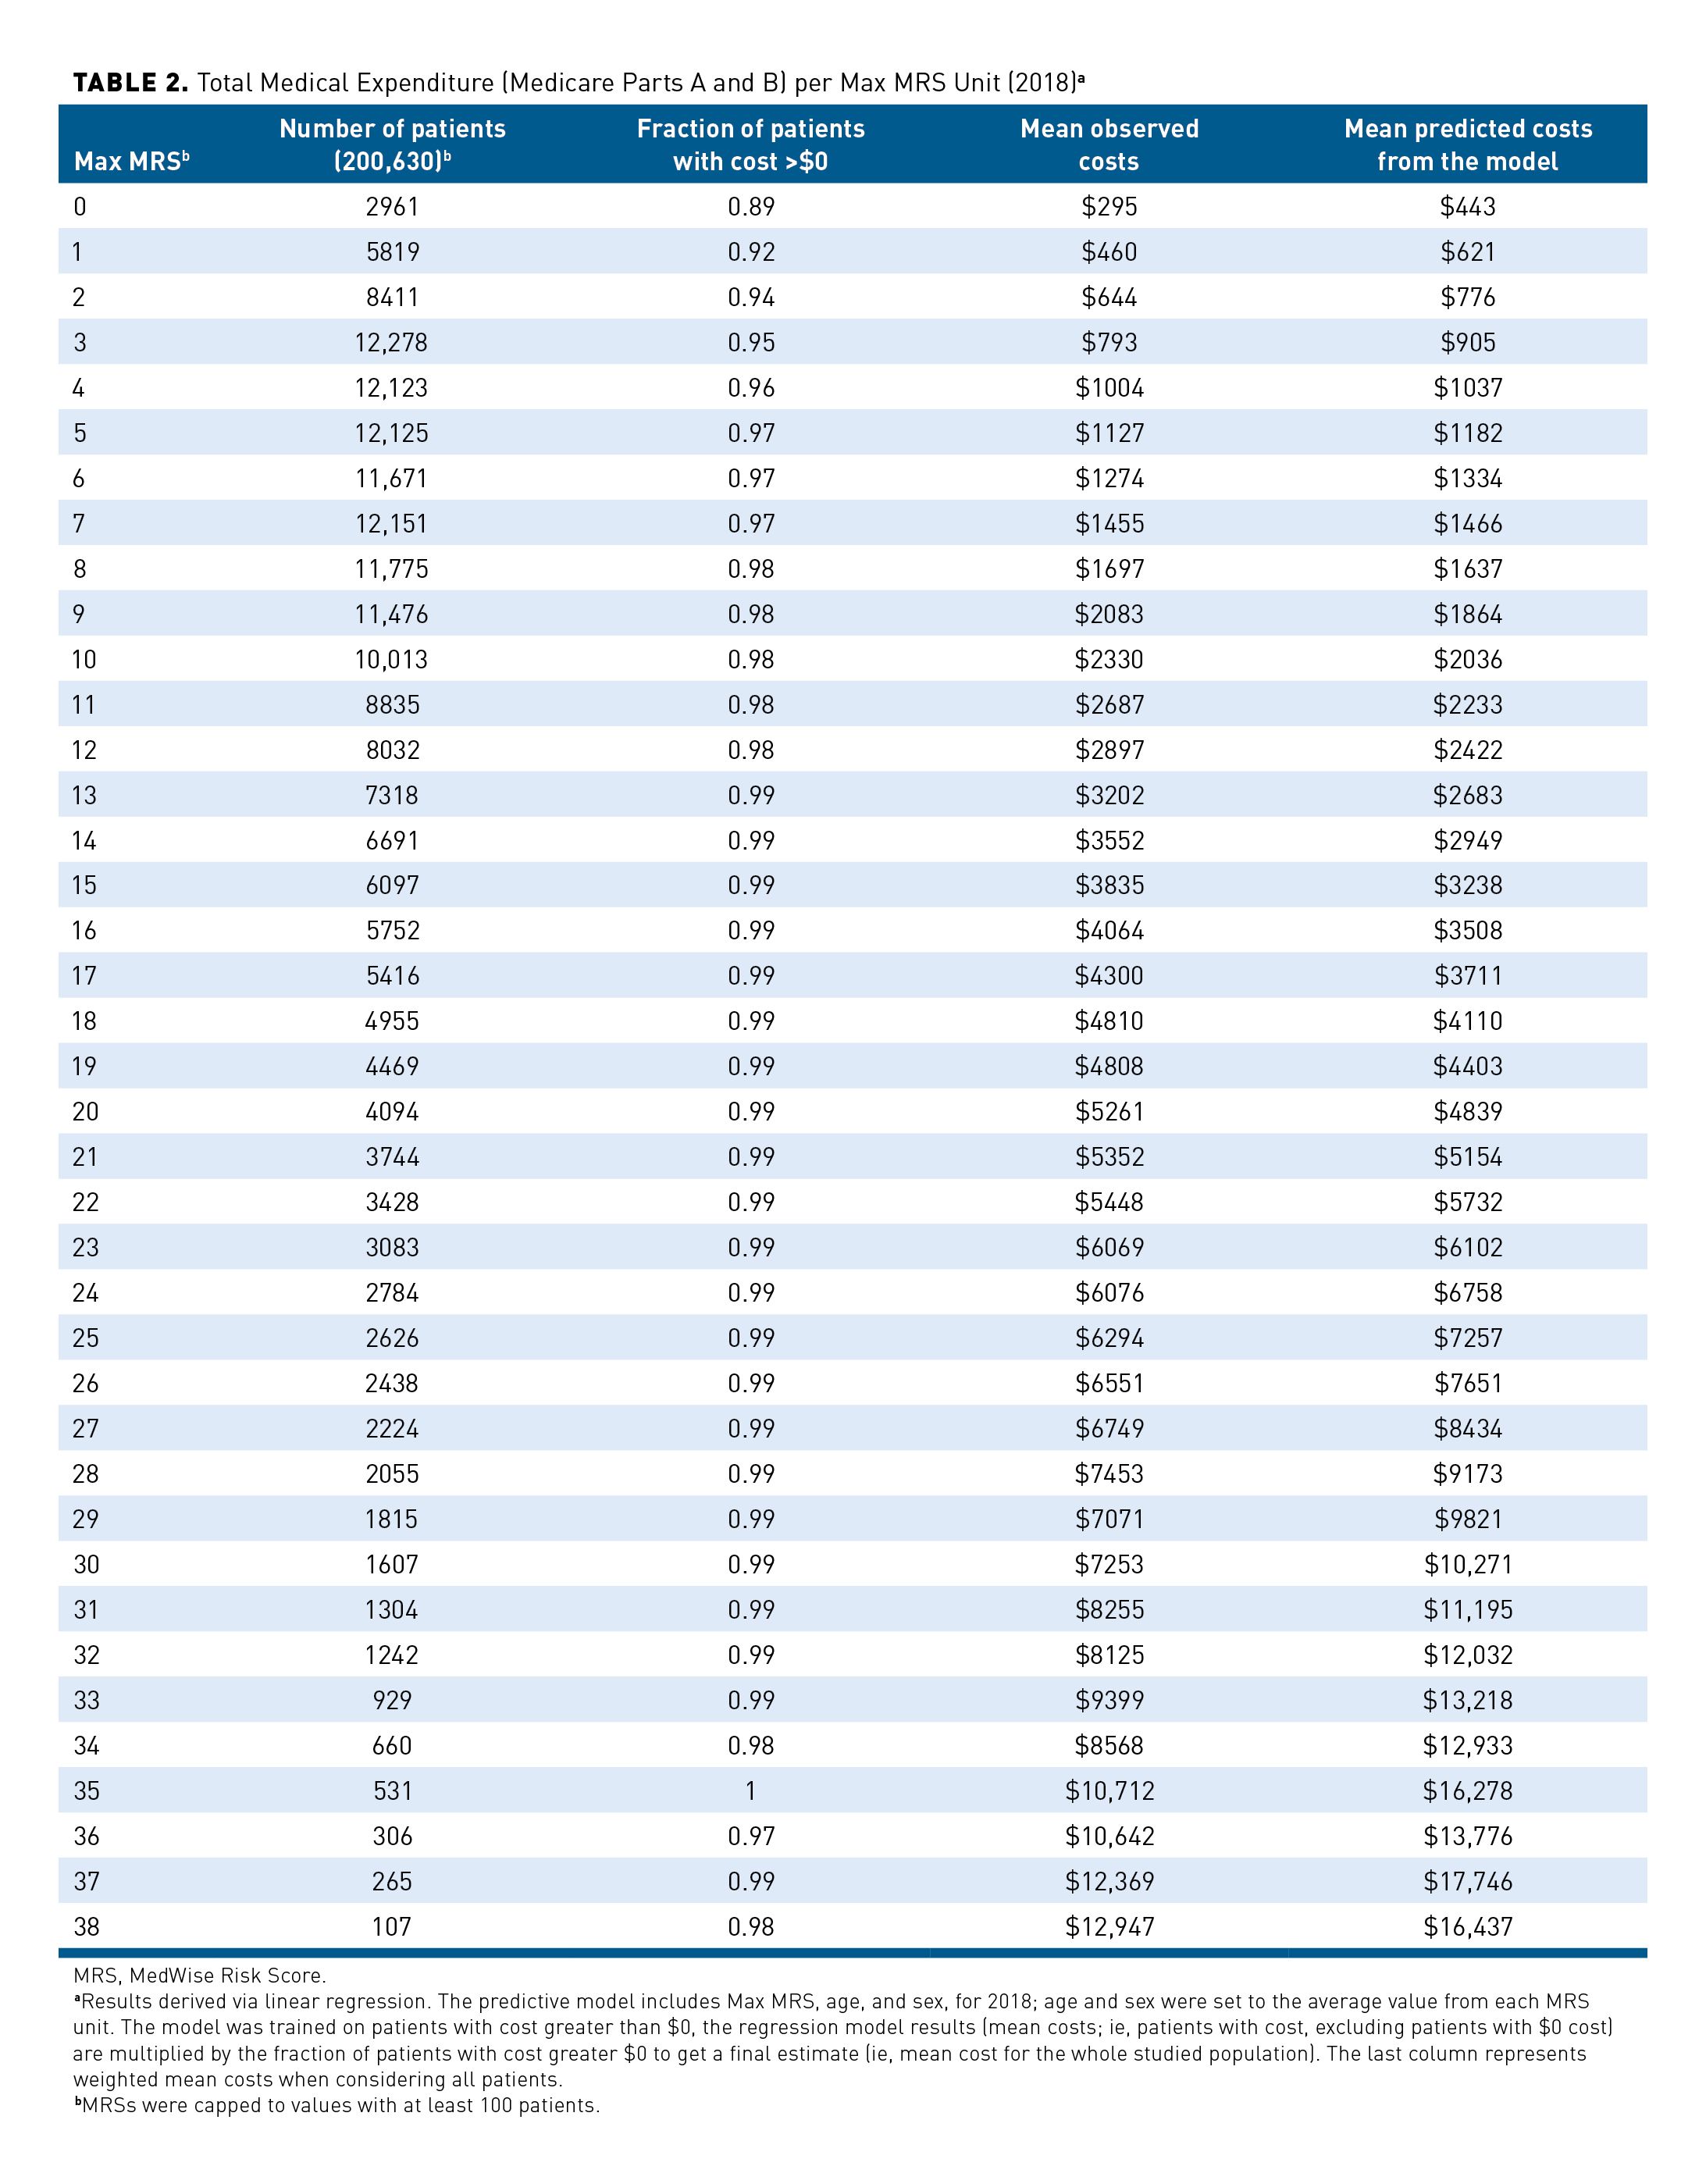
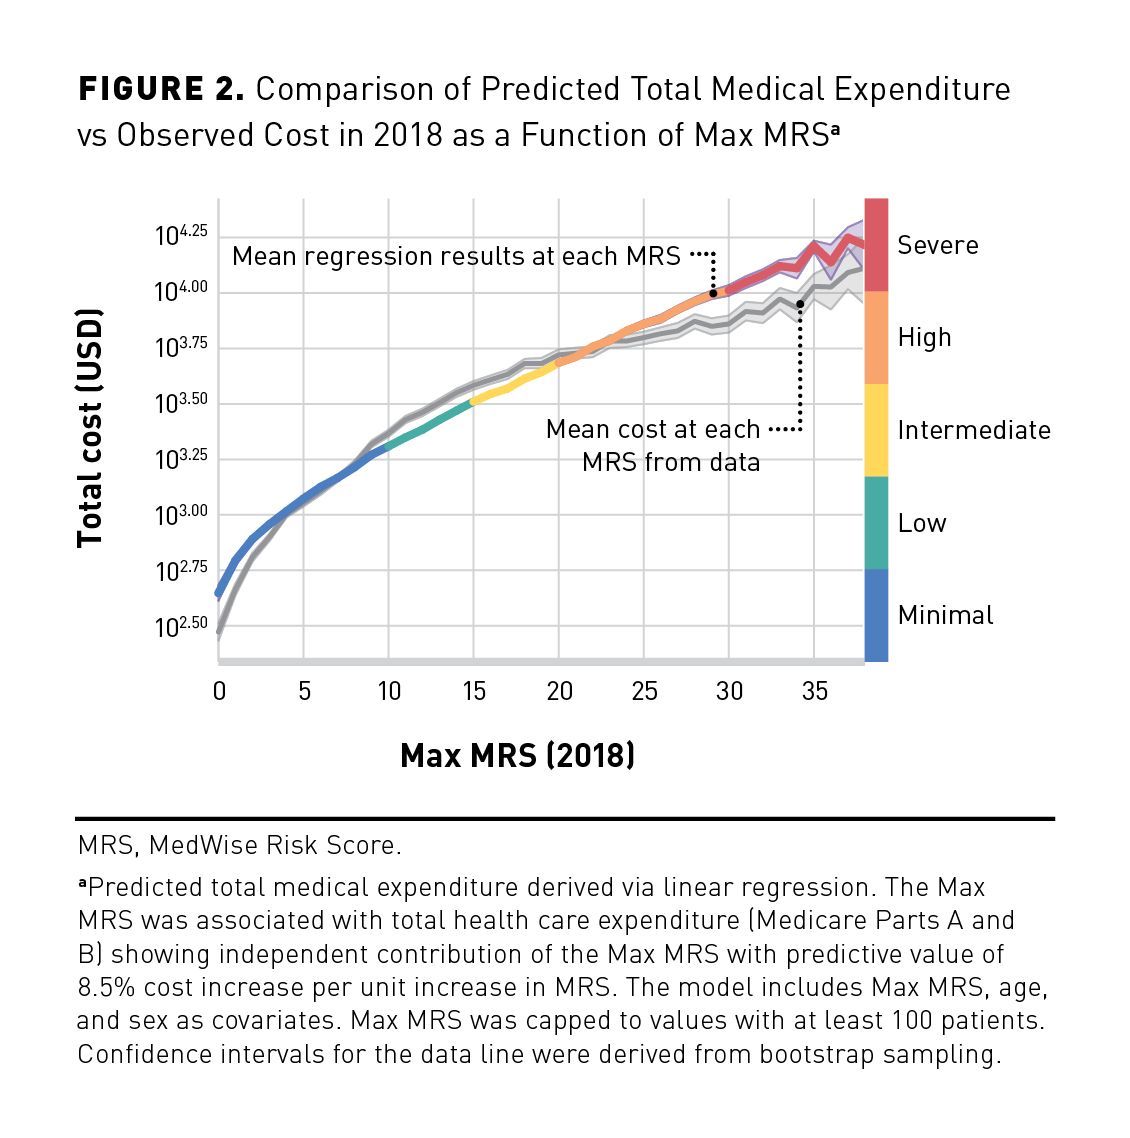
A joint density plot representing total medical expenditure and Max MRS distributions in 2018 is illustrated in Figure 1. The cost distribution shows a large number of individuals with values being zero (n = 5186; 3%) as indicated with a peak at zero cost and a second peak above zero cost. Because of the excess of zero values, count of zero cost values was considered in the regression model. As shown in Table 2, the proportion of individuals with zero cost decreases as the Max MRS increases. The association between the Max MRS and medical expenditure is shown in Figure 2. Our results indicate an association between the total medical expenditure and the Max MRS: Each unit increase of Max MRS is related to an 8.5% increase in total medical expenditure. An MRS of 0 was computed for 2961 patients in this population, which is associated with an average annual expenditure of $295 (observed). In contrast, patients with an MRS of 38 (n = 107) have an average annual expenditure per patient of $12,947 and a predicted mean cost of $16,437 when adjusted for age and sex.
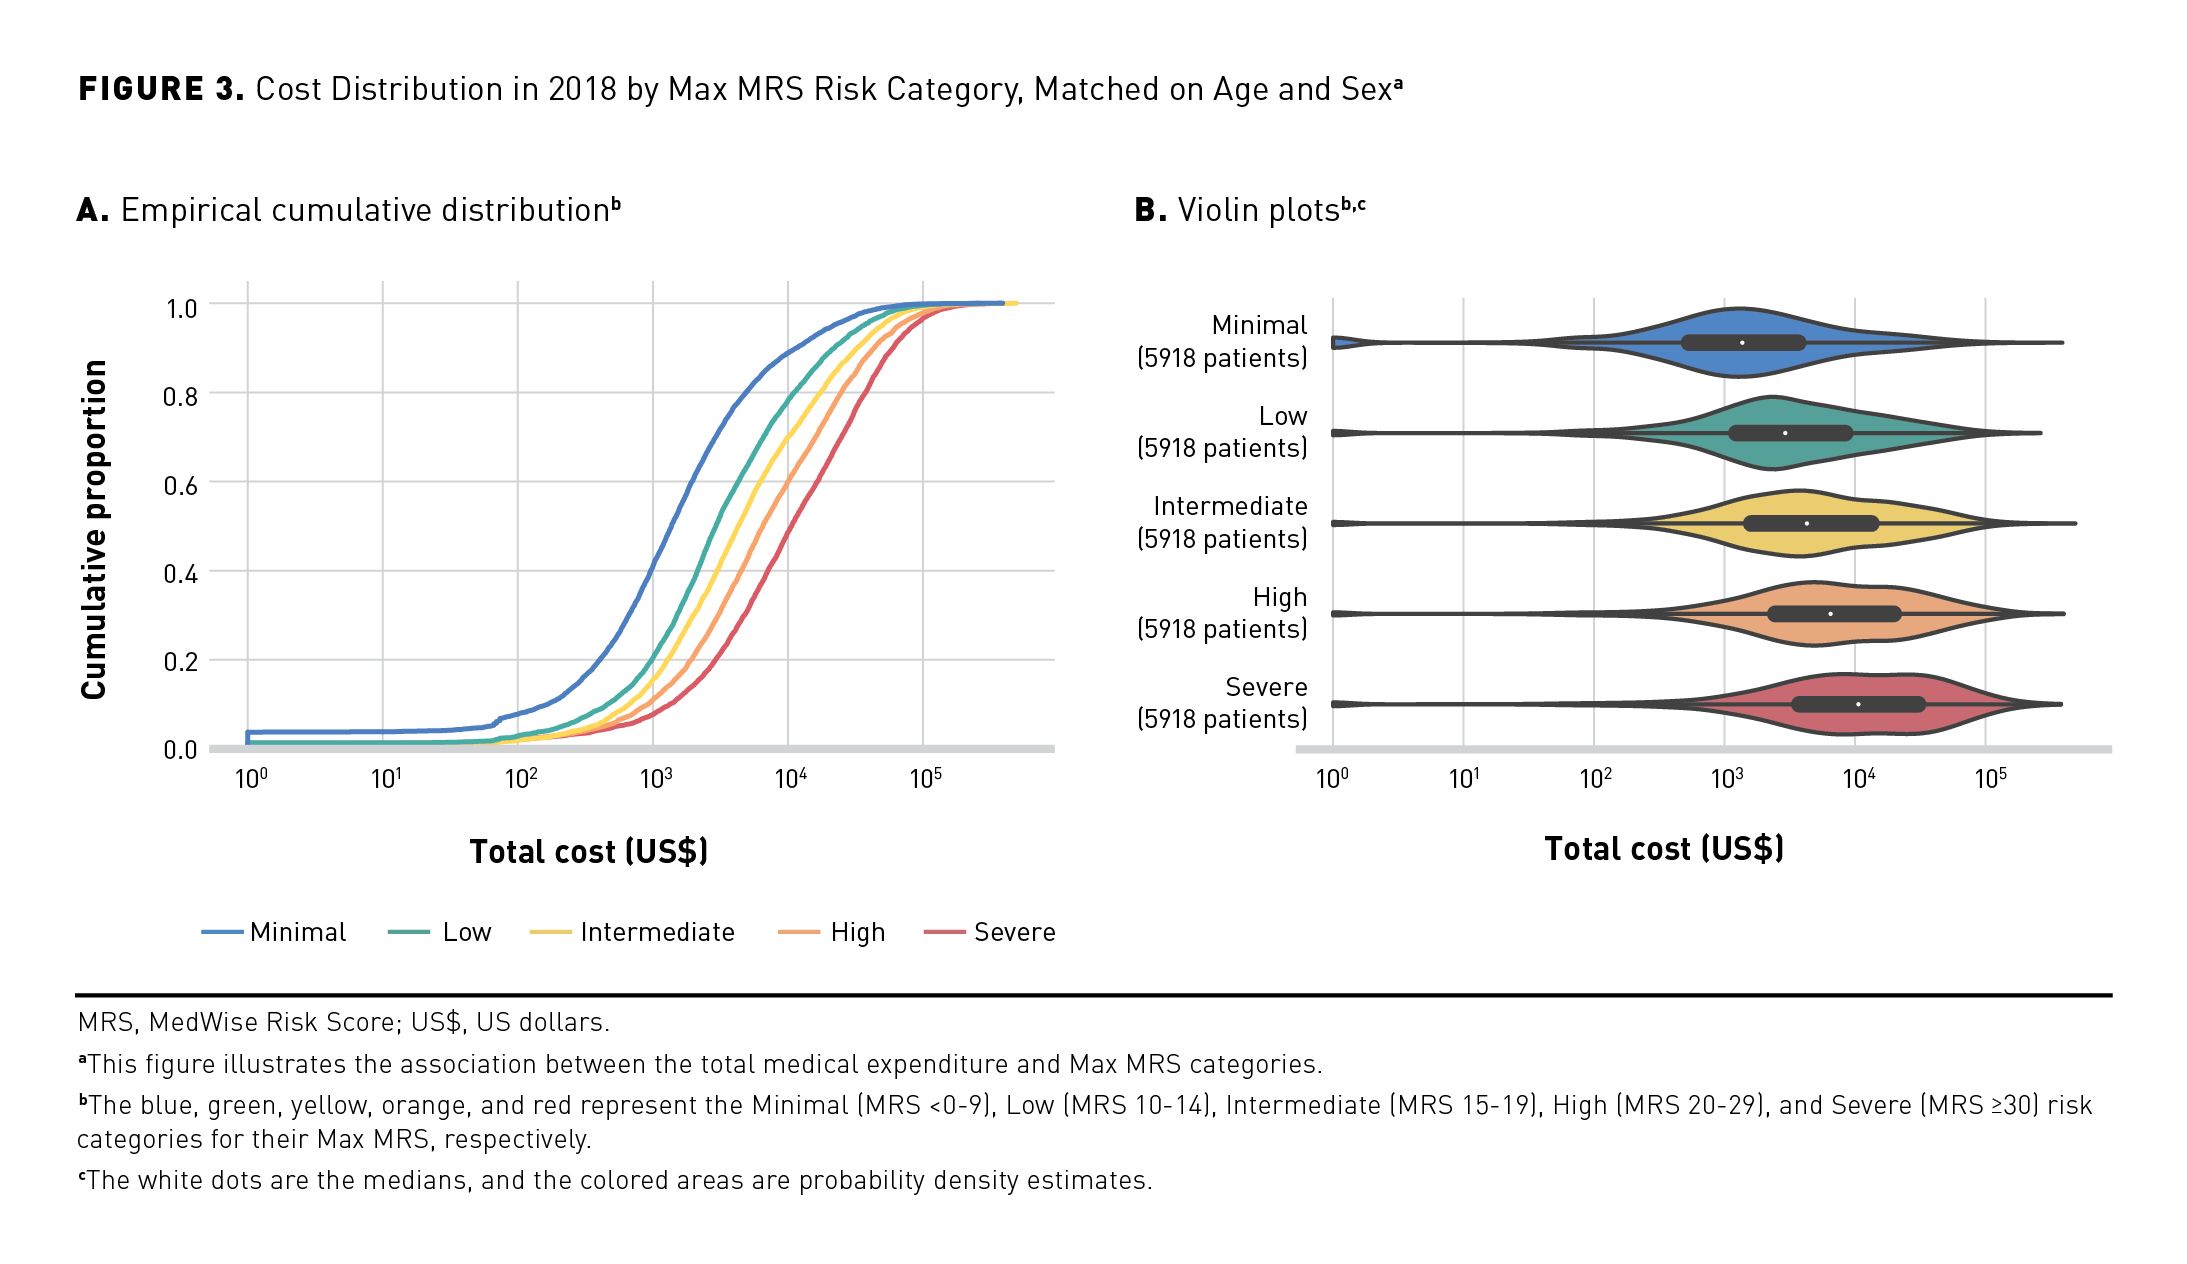
The annual medical expenditure was stratified per MRS group (Figures 3a and 3b). The empirical cumulative distribution indicates that 50% of the population in the Minimal MRS group had a mean yearly medical cost of $1297, compared with $10,352 in the Severe MRS group (Figure 3a). The violin plots showed that the yearly mean medical expenditure increased based on the MRS groups: $1297, $2964, $4532, $6514, and $10,352 from Minimal to Severe MRS groups, respectively (Figure 3b).
MRS, ADEs, Falls, and Mortality
Elevated Max MRSs were associated with increases in negative patient outcomes, including ADEs, falls, and mortality. A total of 9919 (4.9%) patients reported having at least 1 ADE (Table 1). Our results demonstrated that the percentage of patients with Intermediate, High, and Severe MRSs was higher if patients experienced at least 1 ADE (18.6%, 26.5%, and 9.9%, respectively) compared with those without any confirmed ADEs (15.5%, 17.6%, and 5.0%, respectively; Figure 4a). The ORs for having at least 1 ADE per MRS unit and per MRS category are shown in Table 3. When adjusted for age, sex, and CCI score (model 6), the model estimated a 5.8% increase in OR of having an ADE per increase in MRS unit. A significant increase in risk of ADEs was observed when compared with the Minimal MRS group (reference): ORs ranged from 1.824 to 4.542 for Low MRS to Severe MRS groups, respectively (Table 3).
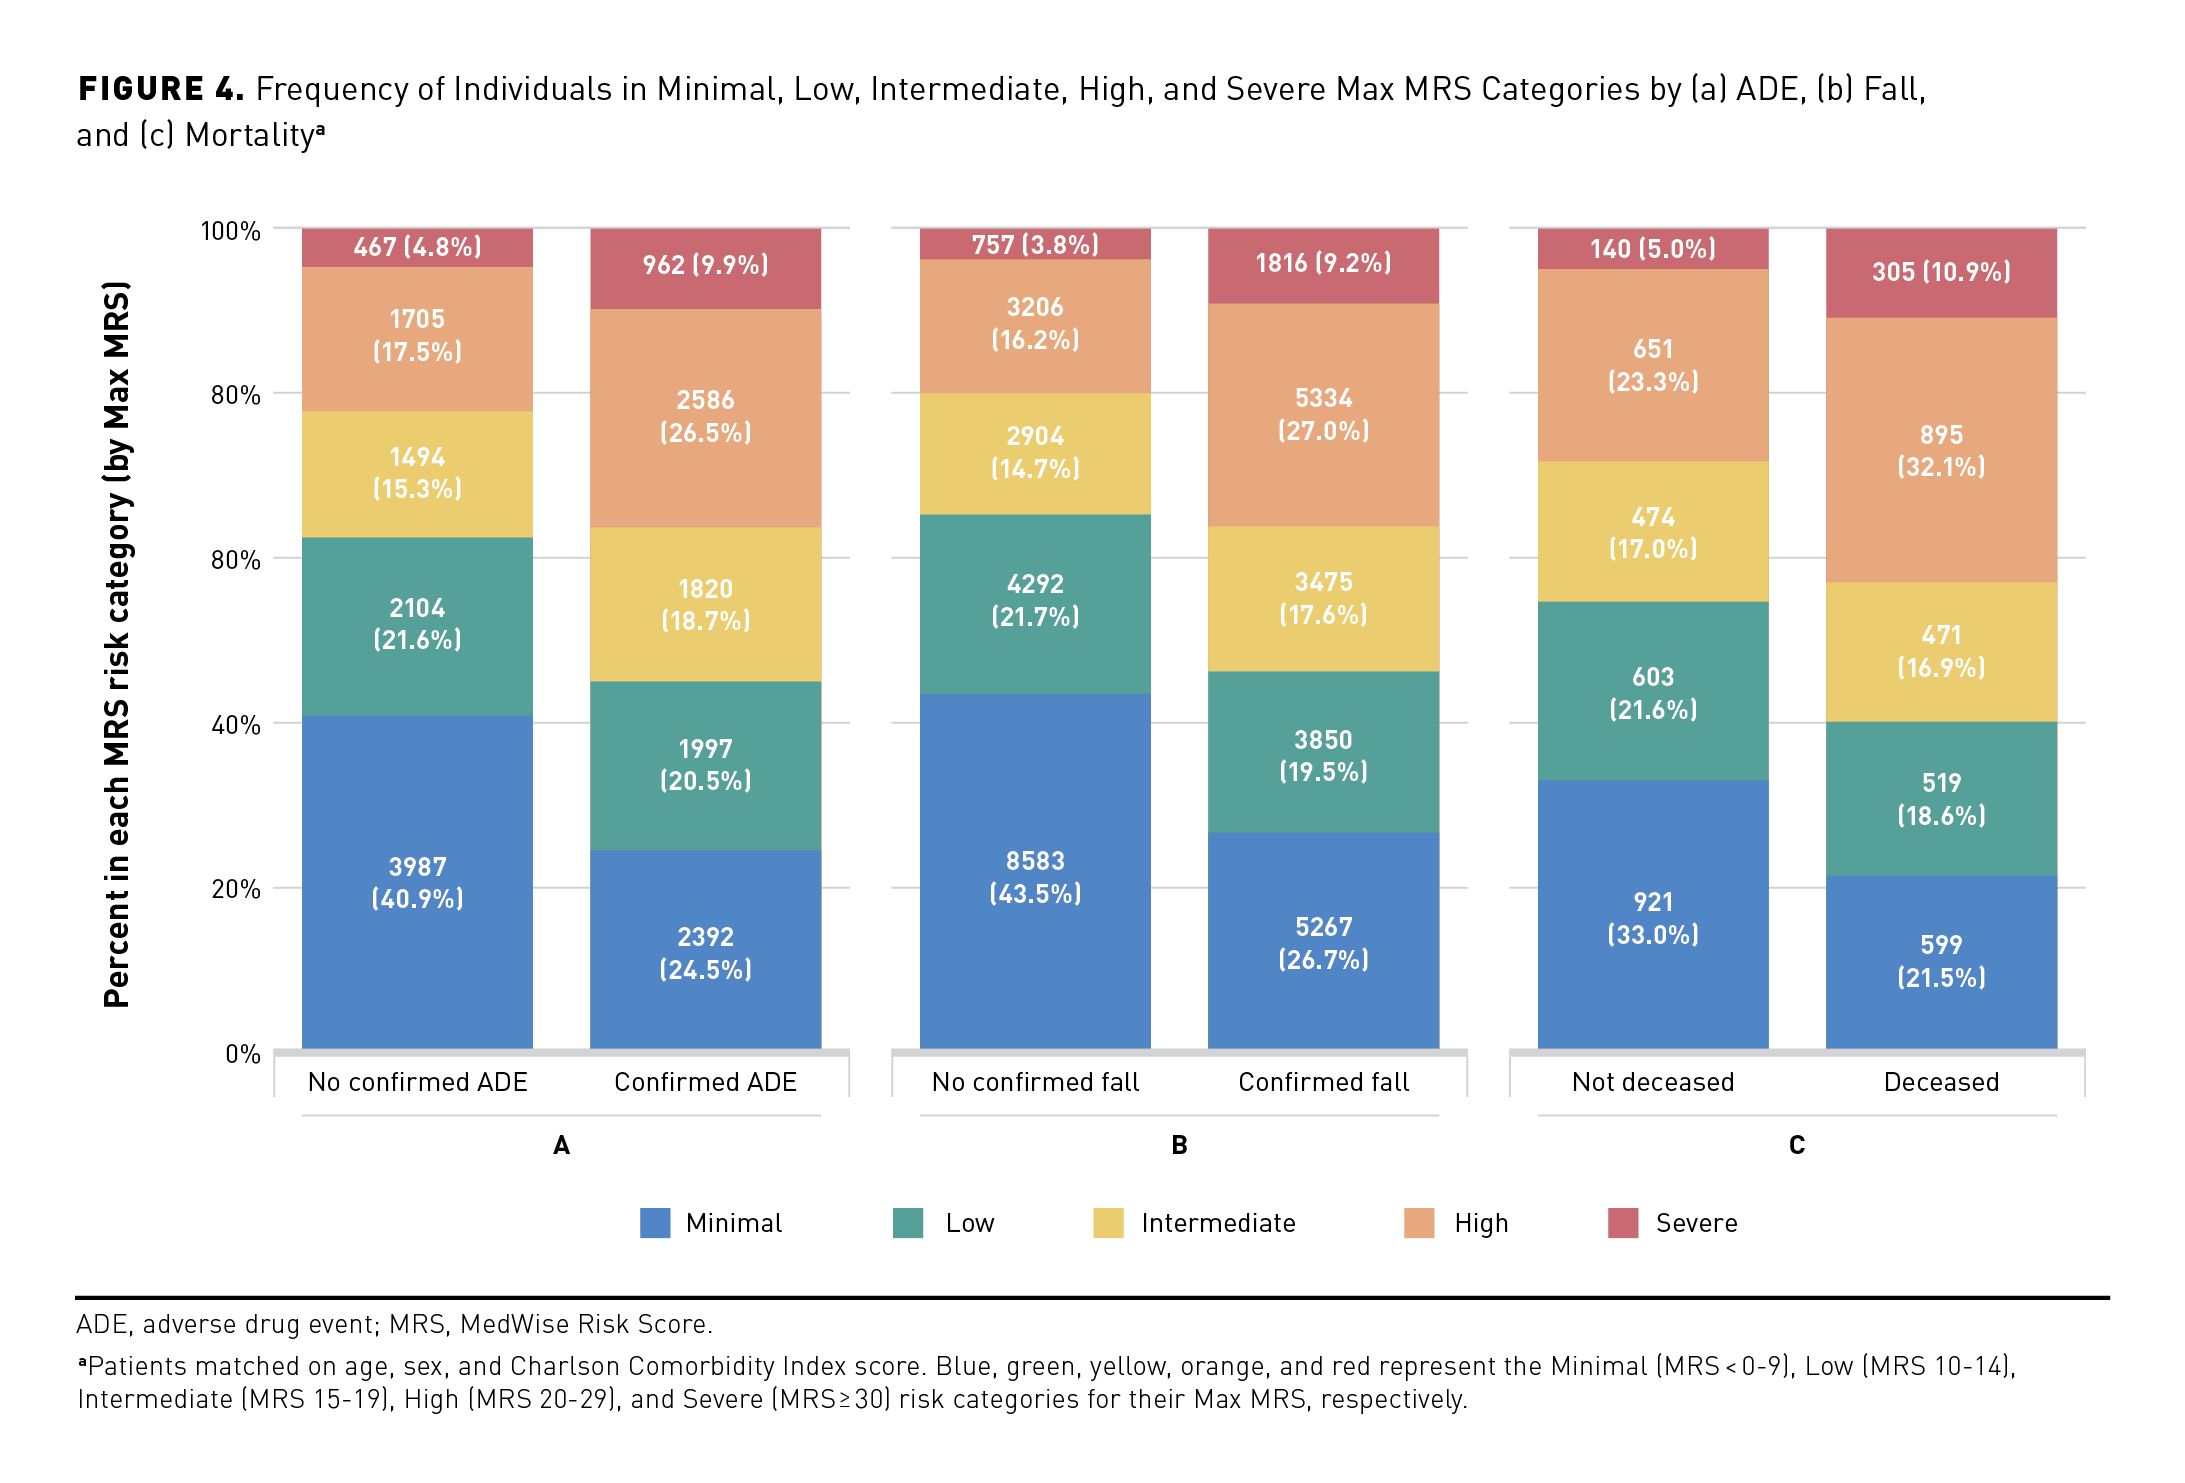
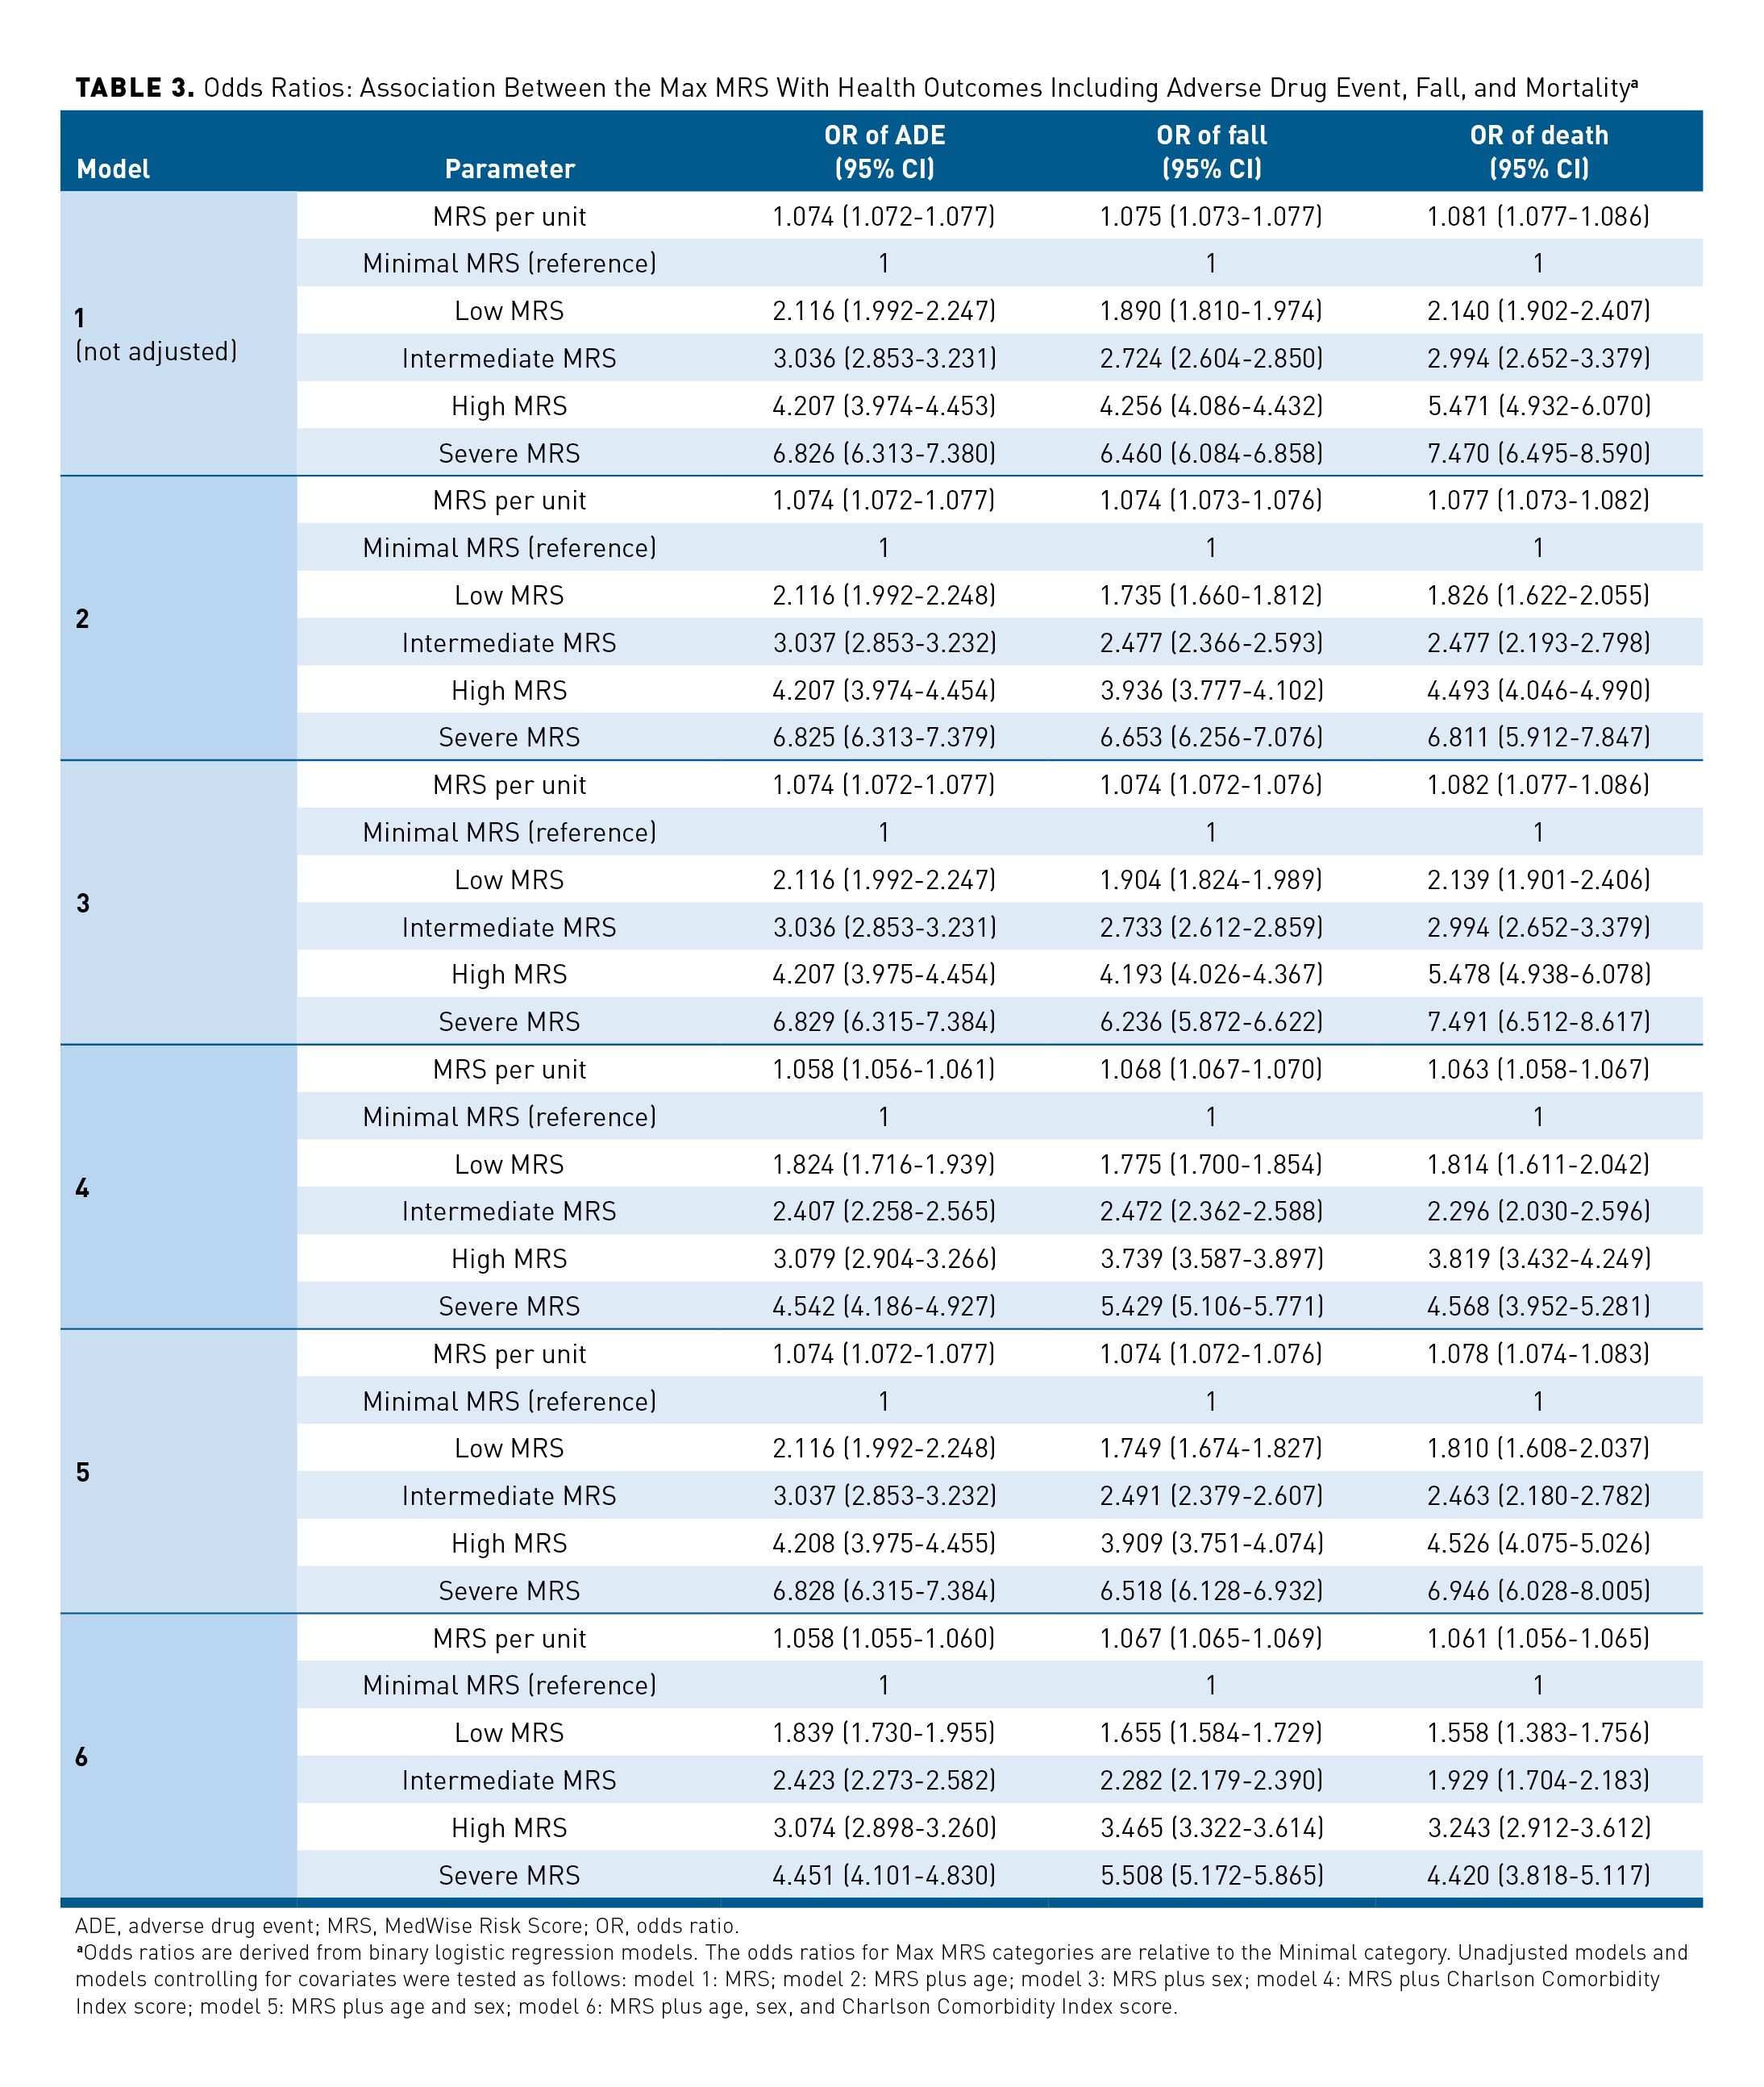
In 2018, 9.8% (n = 19,863) of the studied population reported experiencing at least 1 fall (Table 1). The median Max MRS was greater among patients who experienced at least 1 fall, compared with those without a confirmed fall (16 vs 9, respectively, matched for age, sex, and CCI score). Among individuals who experienced at least 1 fall, higher frequencies of those in the High and Severe MRS categories were observed, compared with the group without confirmed falls (27.0% vs 16.4% and 9.2% vs 3.7%, respectively; Figure 4b). The OR of experiencing at least 1 fall was 1.075 (95% CI, 1.073-1.077) per each MRS unit (unadjusted model; Table 3). This OR remains significant when adjusted for age, sex, and CCI score, with an OR of 1.067 (95% CI, 1.065-1.069) per MRS unit (model 6 including age, sex, and CCI score). Individuals with Intermediate, High, and Severe MRS had a 2.282-, 3.465-, and 5.508-times higher likelihood of experiencing a fall compared with the Minimal risk group, respectively (model 6; Table 3).
An elevated MRS also resulted in increased mortality in this population, with 2813 deaths reported during the studied period (Table 1 and Figures 4a, 4b, and 4c). Compared with patients still alive, a higher percentage of individuals with Intermediate, High, and Severe MRSs died during the studied period (the death analysis: January 2018 to March 2019) (Figure 4c). The effect of the Max MRS was 1.081 (unadjusted model) and 1.061 (adjusted model) on the odds that death occurs per MRS unit (Table 3). Analyses performed with MRS categories revealed that individuals having Low, Intermediate, High, or Severe MRS had an OR of dying that was 1.558, 1.929, 3.243, or 4.420 times higher than that of the Minimal MRS group (Table 3). The Max MRS distribution among patients experiencing studied health outcomes showed a shift of the Max MRS density distribution and higher Max MRS median values among patients who had at least 1 ADE or fall or who died (unadjusted and adjusted analyses; eAppendix Figure 4).
MRS, ED Visits, and Hospitalizations
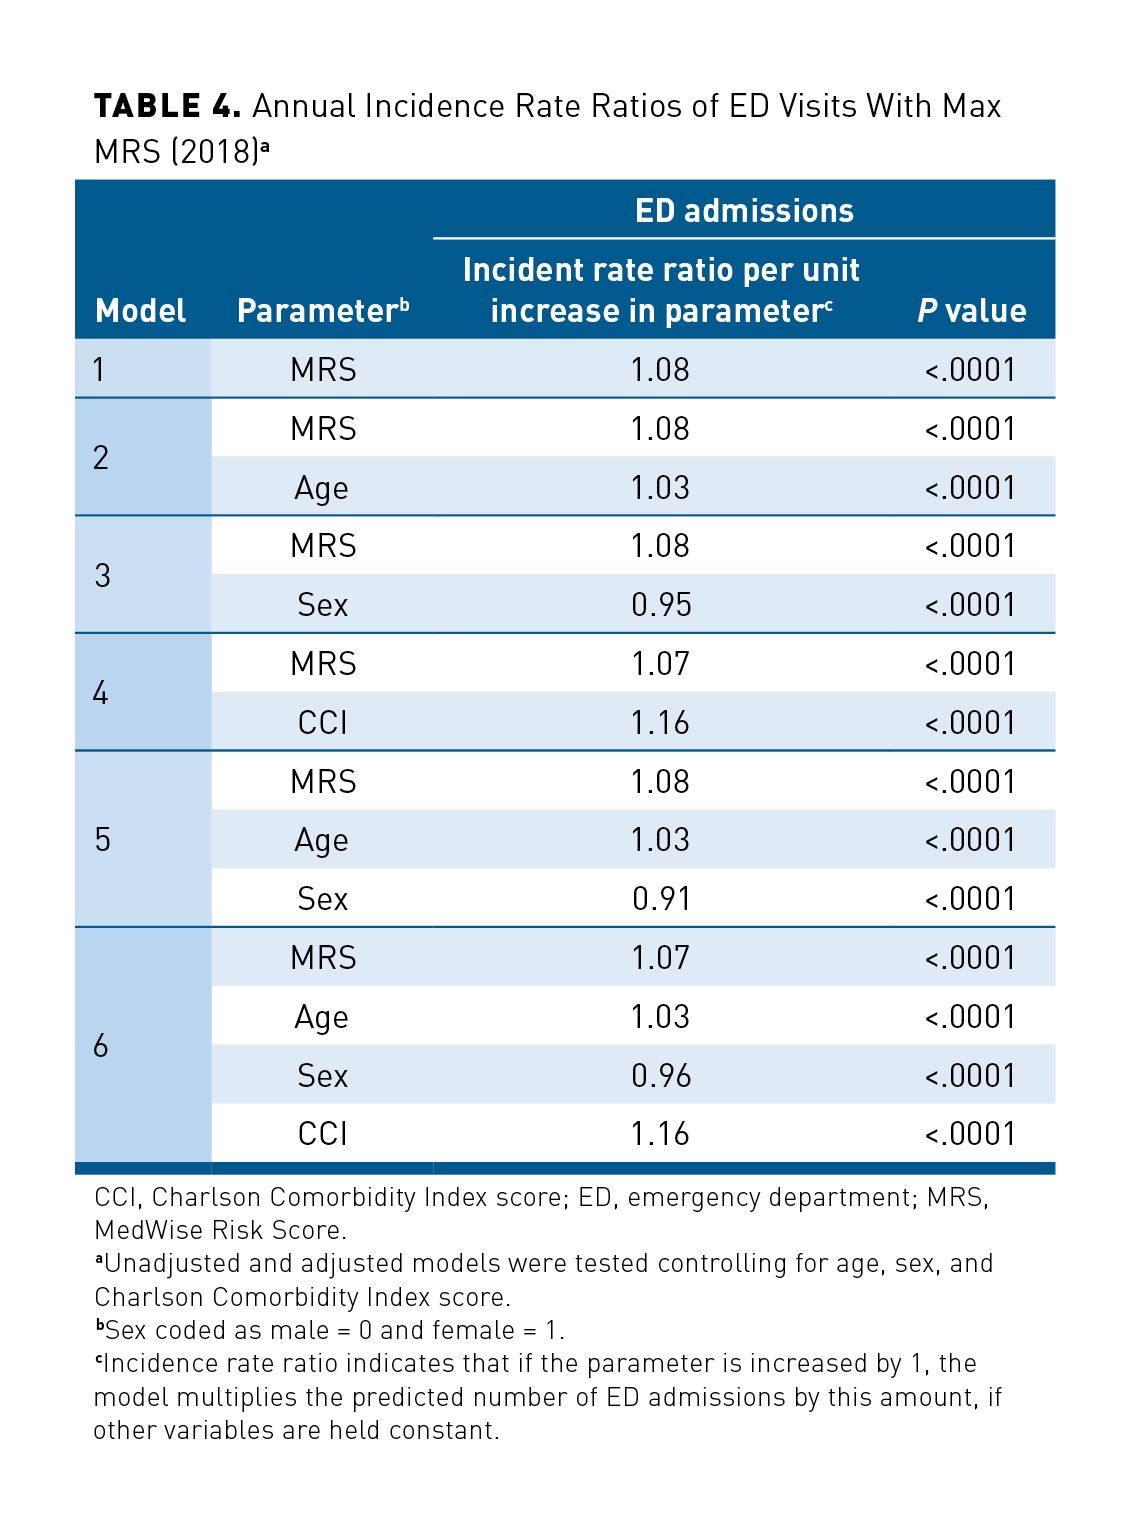
A total of 49,804 individuals requiring ED admissions was recorded, with 153,887 patients reporting no ED admission for the full year of 2018 (Table 1). Because of the overdispersion of ED admissions and ED admission being a count variable, negative binomial regressions were conducted. The IRRs of ED visits were 1.08 and 1.07 (unadjusted and adjusted models, respectively) per MRS unit, meaning that the number of expected ED visits increased by 7% per 1-unit increase of the MRS per year (P < .0001; Table 4). In addition, our results suggest that models predicted a 16% increase of ED admission per CCI score unit and that female patients had an IRR of ED visits 5% to 9% lower than that of male patients.
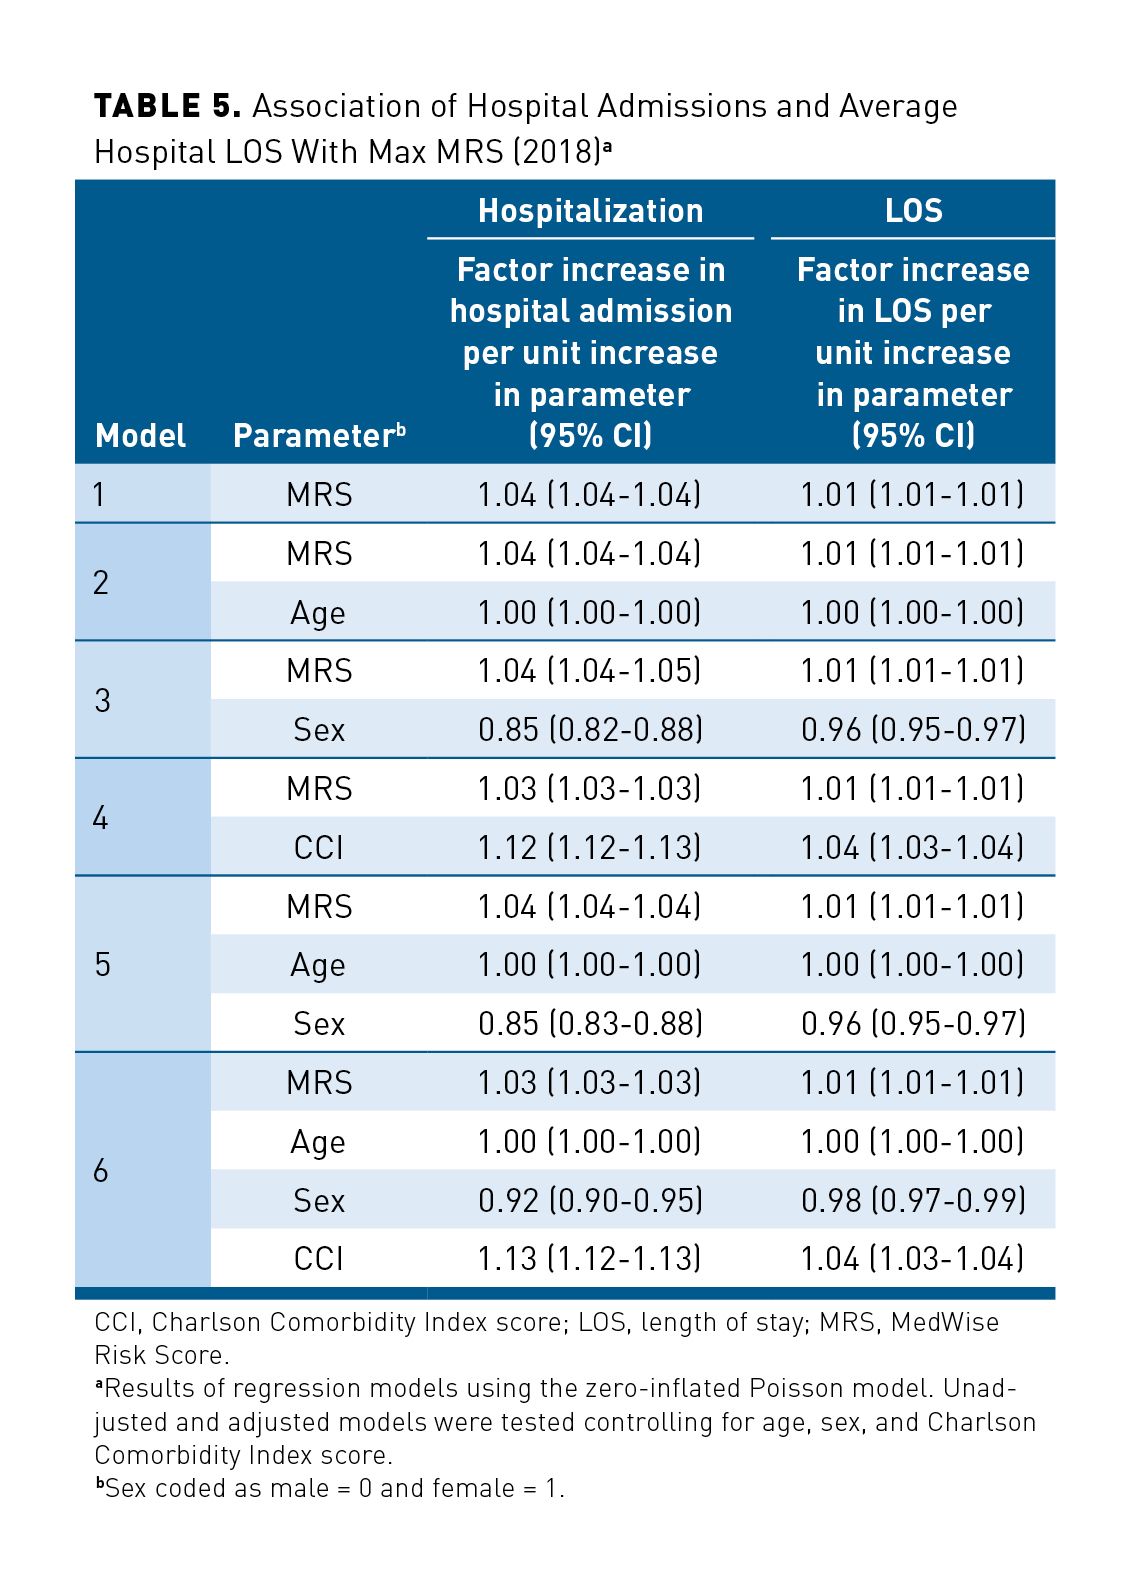
Similar results were observed for hospital admission. Among the studied population, 31,505 patients were hospitalized, with a total of 45,758 hospital admissions in 2018. The associations between the Max MRS and hospitalizations and between the Max MRS and hospital LOS are shown in Table 5. The adjusted model (including Max MRS, age, sex, and CCI score) predicted a 3% increase of hospital admissions per 1-unit increase of the MRS (Table 5). In our regression model, adjusted ORs for the LOS in hospital was 1.01 per each unit increase in MRS. Our adjusted regression models showed that CCI score and sex were also associated with hospitalizations and the LOS, with a greater association with hospital admissions: Hospital admission was lower in female patients (OR, 0.92; 95% CI, 0.90-0.95), and hospitalization was predicted to increase by 13% per unit of CCI score.
Discussion
This retrospective study aimed to examine the association of MRS with patient outcomes, including ADEs, falls, and mortality, as well as with medical expenditures, ED visits, hospitalizations, and hospital LOS in a polymedicated Medicare Part D population in 2018. The Max MRS was significantly associated with risk of experiencing ADEs, falls, and death with adjusted ORs of about 1.06 to 1.07 per unit increase of MRS (model 6). The nonzero cost regression model estimated an 8.5% increase in total medical expenditure per each unit increase of MRS. Our model predicted 7000 ED visits for every 100,000 subjects per 1-unit increase of the MRS per year. Our results showed an association between the Max MRS and hospital admissions and hospital LOS, with increasing risk of events occurring per unit of MRS.
A comparative analysis of Max MRS and Mean MRS models based on performance indicators was conducted (eAppendix Tables 2, 3, and 4). Even though certain metrics have similar values in different models tested, models using the Max MRS generally performed better. In addition, predicted model expenditure showed that the Max MRS had a predictive value of 8.5% cost increase per unit increase of the MRS vs 7.8% with the Mean MRS. It should be noted that even though the difference is small, it becomes more important as the MRS values increase (as an exponential function). Overall risk predictions remain relatively close with a trend toward better performance with the Max MRS. Furthermore, the computation of the Max MRS is less tedious and is preferable because of its simplicity compared with the Mean MRS.
ADEs are increasingly common in aging populations. In 2003, Gurwitz et al reported that in the United States, ADEs occur at a rate of approximately 50 per 1000 patient-years (5.0%).21 This is consistent with the results of our study, where 9919 (4.9%) patients reported having at least 1 ADE during the year 2018. When compared with the Minimal MRS group, the odds of having at least 1 ADE increased progressively with higher MRS categories: ORs of 1.82, 2.41, 3.08, and 4.54 for the Low, Intermediate, High, and Severe MRS groups, respectively (model 6). Predictive models of ADEs reported in the literature are usually limited to specific and unique ADEs such as acute renal failure, liver injury, and upper gastrointestinal bleeding.22-24 In addition, such models are often limited for measuring causality or severity and cannot be utilized as predictive risk tools.25,26 The MRS used in our study is novel and uses a population-tailored stratification strategy to identify patients at risk of ADEs for a given drug therapy regimen.
In the United States, the leading cause of traumatic, or injury-related, mortality in older adults is falls from a standing position. In 2014, 2.8 million ED visits occurred in the United States for fall-related injuries in older adults; from these, approximately 800,000 patients were hospitalized.27 A total of 29,668 US residents aged 65 years or older died as the result of a fall in 2016, up from 18,334 in 2007. Furthermore, 30% of older US adults (≥ 65 years) reported at least 1 fall during 2014; these estimated 29 million falls resulted in approximately 7.0 million injuries and approximately 27,000 deaths.28 In our elderly studied population, approximately 10% experienced at least 1 fall in 2018. The number of falls observed in our study is lower than the number of falls reported in the literature (about 30%); this difference could be due to the fact that only falls severe enough to require care were detected using ICD-10 codes.
According to the CDC, falls can be prevented by addressing risk factors, such as drug regimen or poor strength and balance, and injury-related deaths can be prevented by identifying a patient’s number of falls, reviewing drug regimens, and prescribing interventions, such as physical therapy.29 Our study demonstrated that the risk of experiencing a fall was significantly associated with the MRS: Odds of a fall were 2.28, 3.47, and 5.43 times higher in patients with Intermediate, High, and Severe MRSs compared with those in the Minimal MRS (comparison) group. The MRS could be used as an indicator of fall risk in a preemptive manner based on drug regimen.
Age is undeniably associated with hospitalization occurrence. The Agency for Healthcare Research and Quality reported that adults 65 years and older accounted for about 35% of all US population hospital discharges in 2008.30 In 2018, 14.2% of persons aged 65 to 74 years had at least 1 hospitalization; the rate rose to 19.6% for patients aged 75 to 84 years.31 In agreement with these statistics, we observed in our study population that 15.5% of older adults (mean age, 76 years) had 1 or more hospitalization in 2018.
The performance of the logistic regression models was measured using ROC curves: The AUC ROCs were 0.74 and 0.73 for ADEs and falls, respectively (model 6; eAppendix Table 2). The MRS in the studied population was moderately discriminative for these outcomes (an AUC ROC of 0.5 indicates no discrimination; higher values of the AUC ROC curve indicate better accuracy of the predictive model). For death, our models presented an AUC ROC value of 0.83; although there is no absolute cutoff, an AUC ROC of 0.8 or greater is considered to show very good discrimination capability. Various predictive models of death are proposed and published in the literature; many of them are oriented toward specific disease states, such as cancer, liver disease, pneumonia, end-stage organ failure (eg, Child-Turcotte-Pugh, cancer of the liver Italian program score, model for end-stage liver disease, pneumonia severity index, and sequential organ failure assessment). For all these models, median AUC ROC values from 0.73 to 0.84 are reported.32 The Acute Physiology and Chronic Health Evaluation (APACHE) score is the most commonly utilized scoring system to predict mortality in patients admitted to the intensive care unit. Siontis et al calculated summary accuracy measures and reported an AUC ROC of 0.79 for the APACHE II scoring tool.32 The Length of Stay, Acuity, Comorbidities, ED visits (LACE) index is also used to predict the risk of early death within 30 days of discharge.33 The C statistic of the LACE index developed by Van Walraven et al for early death was estimated at 0.79.33 Overall, models based on MRS used in our study showed better or similar accuracy in death prediction (model 6; AUC ROC 0.83), even while considering that the MRS is not limited to specific diseases or specific settings compared with other scoring tools.34-38 Our results indicate that the MRS is a powerful tool to foresee the increased risk of death associated with drug-related problems, as demonstrated previously.17
Unfortunately, an ED visit by an older person can indicate a higher risk for morbidity and mortality.39 The LACE index is primarily used to predict the risk of unplanned readmission of patients after discharge from the hospital to community.33 Van Walraven et al reported that each 1-point increase in the LACE index increased the odds of unplanned readmission by 18%.33 One significant limitation of the LACE index is that it cannot be used to predict a first ED visit event.
Several models have been developed to predict patients’ total health care costs, and there are major differences in the approaches used or developed in these models.40-43 Some are predictive models developed for inpatient expenditures, whereas others are predictive cost models based on diagnosis and/or chronic diseases or based on drug counts.40-43 Jodicke et al developed a predictive model for patients’ health care costs in the subsequent year using health insurance claims data.43 Similar to our approach, they particularly focused on the role of pharmacotherapy. They demonstrated an association between probabilities of increased costs and pharmacotherapy by targeting specific drug groups prescribed to treat chronic conditions.43
In contrast, our MRS considers drugs from all pharmacological classes, is sensitive to drug combination, and is based on the peculiar pharmacological properties of each of these drugs. Additionally, it considers that even if a patient is treated according to disease treatment guidelines, the combination of drugs received for multiple chronic conditions present in this patient may not represent an optimal drug regimen. Hence, our model addresses and quantifies mostly the appropriateness of the drug regimen rather than targeting specific drugs or drug classes. Further, compared with other models, drug information is not used as a proxy to derive diseases to subsequently link diseases to health care risk.44,45 The association we derive among the MRS, medical expenditures, and health outcomes is comprehensive.
Limitations
There are limitations associated with the methods utilized in this study. Prescription drug and medical cost claims data are limited by the accuracy and timeliness of the information, and our cost analysis was restricted to Medicare Parts A and B claims data. Additionally, health outcomes are driven by behavioral, social, and environmental factors, which were not captured and considered in our study. Nevertheless, this is not unique to our study, as most predictive models face similar limitations.
Conclusions
Several factors contribute to the rising costs of nonoptimized prescribing, including the rapid growth of the aging US population. It is estimated that by 2030, the number of Medicare enrollees could reach 81.8 million.9 The MRS described in this study can help decision-makers identify patients at risk for higher medical expenditures and optimize health care services for these preidentified groups. Subsequently, the MRS provides information on individual drug regimens, helping health care providers identify medications that contribute to an elevated MRS. Our results suggest that the use of the MRS can provide information to reduce health care costs and optimize prescribing practices.
Acknowledgments
The authors would like to thank Dr Calvin Knowlton and Dr Orsula Knowlton for their forward-looking vision and unequivocal, lifelong dedication to the advancement of the pharmacy profession; Brian Litten for legal counsel and support of the program; and Beth Eichfeld for her involvement as program manager. We also thank the following individuals from ClearStone: Lucas Castillo, Jenny Steinke, Bonnie Haukom, Sarah Legatt, Nick Jejel, Paul Fischer, Angela Mitchell, and Nancy Sheehan. We would like to thank Serge Simard for his assistance with statistical analysis. We thank Dana Filippoli for her review of the manuscript.
Author affiliations: Precision Pharmacotherapy Research and Development Institute, Tabula Rasa HealthCare, Orlando, FL, and Université de Montréal, Montréal, Québec, Canada (VM); Precision Pharmacotherapy Research and Development Institute, Tabula Rasa HealthCare, Orlando, FL (MKS, RB, PD); ClearStone Solutions, Government Markets Division, Blue Cross and Blue Shield of Minnesota, Eagan, MN (JJ); Office of Healthcare Analytics, Tabula Rasa HealthCare, Moorestown, NJ (AS, SF, HJ); Tabula Rasa HealthCare, Orlando, FL, and Université de Montréal, Montréal, Québec, Canada (JT).
Funding source: Funding was obtained by Blue Cross and Blue Shield Northern Plains Alliance (NPA) in Medicare Part D Region 25 (IA, MN, MT, ND, NE, SD, and WY), the model participant, under the 5-year CMS Innovation Center’s Enhanced Medication Therapy Management (MTM) model. Through the NPA’s Part D plan administrator, ClearStone Solutions, funds were provided to Tabula Rasa HealthCare for delivery of Enhanced MTM services and research. In this study, data were analyzed regardless of patient’s enrollment in the Enhanced MTM program. This supplement was supported by Tabula Rasa HealthCare.
Author disclosures: Drs Michaud, Smith, Bikmetov, Stein, Finnel, and Turgeon; Ms Dow; and Mr Jin report employment and stock ownership with Tabula Rasa HealthCare. Drs Michaud, Smith, Finnel, Stein, and Turgeon and Mr Jin also report ownership of the MedWise Risk Score used in this study. Drs Michaud and Turgeon and Ms Dow report a funded grant from the National Institutes of Health submitted using the MedWise Risk Score. Dr Johnson reports employment with ClearStone Solutions (an affiliate of Blue Cross and Blue Shield of Minnesota), which administers the Enhanced MTM Pilot on behalf of Blue Cross and Blue Shield Northern Plains Alliance. ClearStone Solutions paid Tabula Rasa HealthCare to provide the Enhanced MTM services described. Drs Michaud and Turgeon report patents received (10,890,577: Methods of treatment having reduced drug-related toxicity and methods of identifying the likelihood of patient harm arising from prescribed medications) and patents pending (Methods of treatment having reduced drug-related toxicity and methods of identifying the likelihood of patient harm arising from prescribed medications: 17/143,936; Population-based medication risk stratification and personalized medication risk score: 16/870,517).
Disclaimer: The contents of this publication are solely the responsibility of the authors and do not necessarily represent the official views of the US Department of Health and Human Services or any of its agencies. The research presented here was conducted by the model participant. Findings might or might not be consistent with or confirmed by the findings of the independent evaluation contractor. CMS considers any findings from the Part D Enhanced MTM model to be preliminary until certified as valid by its Research and Rapid Cycle Evaluation Group (RREG).
Authorship information: Concept and design (VM, SF, JT); acquisition of data (RB, AS, HJ); analysis and interpretation of data (VM, MKS, RB, SF); drafting of the manuscript (VM, MKS, PD, JT); critical revision of the manuscript for important intellectual content (VM, MKS, RB, PD, JJ, JT); statistical analysis (VM, MKS, RB, SF, HJ); provision of study materials or patients (JJ); obtaining funding (JJ); administrative, technical, or logistical support (PD, JJ, AS, SF, JT); supervision (VM, AS, SF, JT); and other−programming and data processing (HJ).
Address correspondence to: Jacques Turgeon, PhD, 13485 Veterans Way, Ste 410, Orlando, FL 32827. E-mail: jturgeon@trhc.com
REFERENCES
1. Institute of Medicine Committee on Quality of Health Care in America; Kohn LT, Corrigan JM, Donaldson MS, eds. To Err is Human: Building a Safer Health System. The National Academies Press; 2000.
2. Brownlee S, Garber J. Medication overload: America’s other drug problem. Lown Institute. April 1, 2019. Accessed May 27, 2021. https://lowninstitute.org/reports/medication-overload-americas-other-drug-problem/
3. Adverse drug events. HHS Office of Disease Prevention and Health Promotion. Updated February 5, 2020. Accessed June 22, 2021. https://health.gov/our-work/health-care-quality/adverse-drug-events
4. National action plan for adverse drug event prevention. HHS Office of Disease Prevention and Health Promotion. 2014. Accessed June 22, 2021. https://health.gov/sites/default/files/2019-09/ADE-Action-Plan-508c.pdf
5. AHRQ national scorecard on hospital-acquired conditions: final results for 2014 through 2017. Agency for Healthcare Research and Quality. Updated July 2020. Accessed June 8, 2021. https://www.ahrq.gov/sites/default/files/wysiwyg/professionals/quality-patient-safety/pfp/Updated-hacreportFInal2017data.pdf
6. Lavan AH, Gallagher P. Predicting risk of adverse drug reactions in older adults. Ther Adv Drug Saf. 2016;7(1):11-22. doi:10.1177/2042098615615472
7. Adverse drug events in adults. CDC Medication Safety Program. Updated October 11, 2017. Accessed June 22, 2021. https://www.cdc.gov/medicationsafety/adult_adversedrugevents.html
8. Rudd RA, Aleshire N, Zibbell JE, Gladden RM. Increases in drug and opioid overdose deaths - United States, 2000-2014. MMWR Morb Mortal Wkly Rep. 2016;64(50-51):1378-1382. doi:10.15585/mmwr.mm6450a3
9. Watanabe JH, McInnis T, Hirsch JD. Cost of prescription drug-related morbidity and mortality. Ann Pharmacother. 2018;52(9):829-837. doi:10.1177/1060028018765159
10. Masnoon N, Shakib S, Kalisch-Ellett L, Caughey GE. What is polypharmacy? a systematic review of definitions. BMC Geriatr. 2017;17(1):230. doi:10.1186/s12877-017-0621-2
11. Marengoni A, Onder G. Guidelines, polypharmacy, and drug-drug interactions in patients with multimorbidity. BMJ. 2015;350:h1059. doi:10.1136/bmj.h1059
12. Doan J, Zakrzewski-Jakubiak H, Roy J, Turgeon J, Tannenbaum C. Prevalence and risk of potential cytochrome P450-mediated drug-drug interactions in older hospitalized patients with polypharmacy. Ann Pharmacother. 2013;47(3):324-332. doi:10.1345/aph.1R621
13. Tannenbaum C, Sheehan NL. Understanding and preventing drug-drug and drug-gene interactions. Expert Rev Clin Pharmacol. 2014;7(4):533-544. doi:10.1586/17512433.2014.910111
14. Bankes DL, Jin H, Finnel S, et al. Association of a novel medication risk score with adverse drug events and other pertinent outcomes among participants of the programs of all-inclusive care for the elderly. Pharmacy (Basel). 2020;8(2):87. doi:10.3390/pharmacy8020087
15. Cicali B, Michaud V, Knowlton CH, Turgeon J. Application of a novel medication-related risk stratification strategy to a self-funded employer population. CareKinesis. 2018 [second quarter]. Accessed June 22, 2021. https://www.carekinesis.com/wp-content/uploads/2018_Cicali_B_Benefits_Q_Application_of_a_novel_medication-related_risk_stratification_strategy.pdf
16. Turgeon J, Michaud V, Cicali B, inventors. Patent WO2019089725 - Population-based medication risk stratification and personalized medication risk score. World Intellectual Property Organization. September 5, 2019. Accessed June 22, 2021. https://patentscope.wipo.int/search/en/detail.jsf?docId=WO2019089725
17. Rondinelli Ratigan AR, Michaud V, Turgeon J, et al. Longitudinal association of a medication risk score with mortality among ambulatory patients acquired through electronic health record data. J Patient Saf. 2021;17(4):249-255. doi:10.1097/PTS.0000000000000829
18. Glasheen WP, Cordier T, Gumpina R, Haugh G, Davis J, Renda A. Charlson Comorbidity Index: ICD-9 update and ICD-10 translation. Am Health Drug Benefits. 2019;12(4):188-197.
19. Charlson ME, Pompei P, Ales KL, MacKenzie CR. A new method of classifying prognostic comorbidity in longitudinal studies: development and validation. J Chronic Dis. 1987;40(5):373-383. doi:10.1016/0021-9681(87)90171-8
20. Smith MK, Bikmetov R, Al Rihani SB, et al. Adverse drug event risk assessment by the virtual addition of COVID-19 repurposed drugs to Medicare and commercially insured patients’ drug regimens: a drug safety simulation study. Clin Transl Sci. Published online March 30, 2021. doi:10.1111/cts.13025
21. Gurwitz JH, Field TS, Harrold LR, et al. Incidence and preventability of adverse drug events among older persons in the ambulatory setting. JAMA. 2003;289(9):1107-1116. doi:10.1001/jama.289.9.1107
22. Noguchi Y, Ueno A, Otsubo M, et al. A simple method for exploring adverse drug events in patients with different primary diseases using spontaneous reporting system. BMC Bioinformatics. 2018;19(1):124. doi:10.1186/s12859-018-2137-y
23. Zhang F, Sun B, Diao X, Zhao W, Shu T. Prediction of adverse drug reactions based on knowledge graph embedding. BMC Med Inform Decis Mak. 2021;21(1):38. doi:10.1186/s12911-021-01402-3
24. White RW, Harpaz R, Shah NH, DuMouchel W, Horvitz E. Toward enhanced pharmacovigilance using patient-generated data on the internet. Clin Pharmacol Ther. 2014;96(2):239-246. doi:10.1038/clpt.2014.77
25. Koh Y, Yap CW, Li S-C. Development of a combined system for identification and classification of adverse drug reactions: Alerts Based on ADR Causality and Severity (ABACUS). J Am Med Inform Assoc. 2010;17(6):720-722. doi:10.1136/jamia.2010.006882
26. García-Cortés M, Lucena MI, Pachkoria K, Borraz Y, Hidalgo R, Andrade RJ; Spanish Group for the Study of Drug-induced Liver Disease (Grupo de Estudio Para las Hepatopatías Asociadas a Medicamentos, Geham). Evaluation of Naranjo adverse drug reactions probability scale in causality assessment of drug-induced liver injury. Aliment Pharmacol Ther. 2008;27(9):780-789. doi:10.1111/j.1365-2036.2008.03655.x
27. Choi NG, Choi BY, DiNitto DM, Marti CN, Kunik ME. Fall-related emergency department visits and hospitalizations among community-dwelling older adults: examination of health problems and injury characteristics. BMC Geriatr. 2019;19(1):303. doi:10.1186/s12877-019-1329-2
28. Bergen G, Stevens MR, Burns ER. Falls and fall injuries among adults aged ≥65 years - United States, 2014. MMWR Morb Mortal Wkly Rep. 2016;65(37):993-998. doi:10.15585/mmwr.mm6537a2
29. Eckstrom E, Parker EM, Shakya I, Lee R. Coordinated care plan to prevent older adult falls. stopping elderly accidents, deaths, & injuries. CDC. 2021. Accessed June 22, 2021. https://www.cdc.gov/steadi/pdf/Steadi-Coordinated-Care-Plan.pdf
30. Wier L, Pfuntner A, Steiner C. Hospital utilization among oldest adults, 2008: statistical brief #103. Agency for Healthcare Research and Quality; 2010. Accessed June 22, 2021. https://www.ncbi.nlm.nih.gov/books/NBK52646/
31. Table 40: persons with hospital stays in the past year, by selected characteristics: United States, selected years 1997-2018. CDC. 2019. Accessed June 22, 2021. https://www.cdc.gov/nchs/data/hus/2019/040-508.pdf
32. Siontis GCM, Tzoulaki I, Ioannidis JPA. Predicting death: an empirical evaluation of predictive tools for mortality. Arch Intern Med. 2011;171(19):1721-1726. doi:10.1001/archinternmed.2011.334
33. van Walraven C, Dhalla IA, Bell C, et al. Derivation and validation of an index to predict early death or unplanned readmission after discharge from hospital to the community. CMAJ. 2010;182(6):551-557. doi:10.1503/cmaj.091117
34. Krüger S, Ewig S, Giersdorf S, Hartmann O, Suttorp N, Welte T; German Competence Network for the Study of Community Acquired Pneumonia (CAPNETZ) Study Group. Cardiovascular and inflammatory biomarkers to predict short- and long-term survival in community-acquired pneumonia: results from the German Competence Network, CAPNETZ. Am J Respir Crit Care Med. 2010;182(11):1426-1434. doi:10.1164/rccm.201003-0415OC
35. Timsit J-F, Fosse J-P, Troché G, et al; OUTCOMEREA Study Group, France. Calibration and discrimination by daily Logistic Organ Dysfunction scoring comparatively with daily Sequential Organ Failure Assessment scoring for predicting hospital mortality in critically ill patients. Crit Care Med. 2002;30(9):2003-2013. doi:10.1097/00003246-200209000-00009
36. Fine MJ, Auble TE, Yealy DM, et al. A prediction rule to identify low-risk patients with community-acquired pneumonia. N Engl J Med. 1997;336(4):243-250. doi:10.1056/NEJM199701233360402
37. Del Bufalo C, Morelli A, Bassein L, et al. Severity scores in respiratory intensive care: APACHE II predicted mortality better than SAPS II. Respir Care. 1995;40(10):1042-1047.
38. Haq A, Patil S, Parcells AL, Chamberlain RS. The Simplified Acute Physiology Score III is superior to the Simplified Acute Physiology Score II and Acute Physiology and Chronic Health Evaluation II in predicting surgical and ICU mortality in the “oldest old.” Curr Gerontol Geriatr Res. 2014;2014:934852. doi:10.1155/2014/934852
39. Shankar KN, Liu SW, Ganz DA. Trends and characteristics of emergency department visits for fall-related injuries in older adults, 2003-2010. West J Emerg Med. 2017;18(5):785-793. doi:10.5811/westjem.2017.5.33615
40. Tierney WM, Fitzgerald JF, Miller ME, James MK, McDonald CJ. Predicting inpatient costs with admitting clinical data. Med Care. 1995;33(1):1-14. doi: 10.1097/00005650-199501000-00001
41. Yang C, Delcher C, Shenkman E, Ranka S. Machine learning approaches for predicting high cost high need patient expenditures in health care. Biomed Eng Online. 2018;17(suppl 1):131. doi:10.1186/s12938-018-0568-3
42. Lemke KW, Weiner JP, Clark JM. Development and validation of a model for predicting inpatient hospitalization. Med Care. 2012;50(2):131-139. doi:10.1097/MLR.0b013e3182353ceb
43. Jödicke AM, Zellweger U, Tomka IT, et al. Prediction of health care expenditure increase: how does pharmacotherapy contribute? BMC Health Serv Res. 2019;19(1):953. doi:10.1186/s12913-019-4616-x
44. Pratt NL, Kerr M, Barratt JD, et al. The validity of the Rx-Risk Comorbidity Index using medicines mapped to the Anatomical Therapeutic Chemical (ATC) Classification System. BMJ Open. 2018;8(4):e021122. doi:10.1136/bmjopen-2017-021122
45. Von Korff M, Wagner EH, Saunders K. A chronic disease score from automated pharmacy data. J Clin Epidemiol. 1992;45(2):197-203. doi:10.1016/0895-4356(92)90016-g

